

The bearish trendline on the 1-hour Nasdaq chart emphasizes the strong presence of sellers. The increasing selling pressure is becoming more apparent with a ZigZag pattern that exhibits volatility while remaining focused on a downward trajectory. This situation is further supported by the declining Moving Average (MA), indicating that the short-term trend is still in a bearish phase. Meanwhile, negative signals from the MACD indicator reinforce the idea that the market is leaning towards potential weakness.
Given these technical indicators, the Nasdaq’s chances of continuing its downward trend during tonight’s US session are increasing. If the sell-off persists, this index may test lower support areas. Investors and traders should remain cautious, as seller dominance could put even more pressure on prices unless there are significant reversal signals. In this scenario, a strategy that follows the bearish trend appears more logical than attempting to seize unclear reversal opportunities.
Recommended

Recommended

Recommended

Recommended
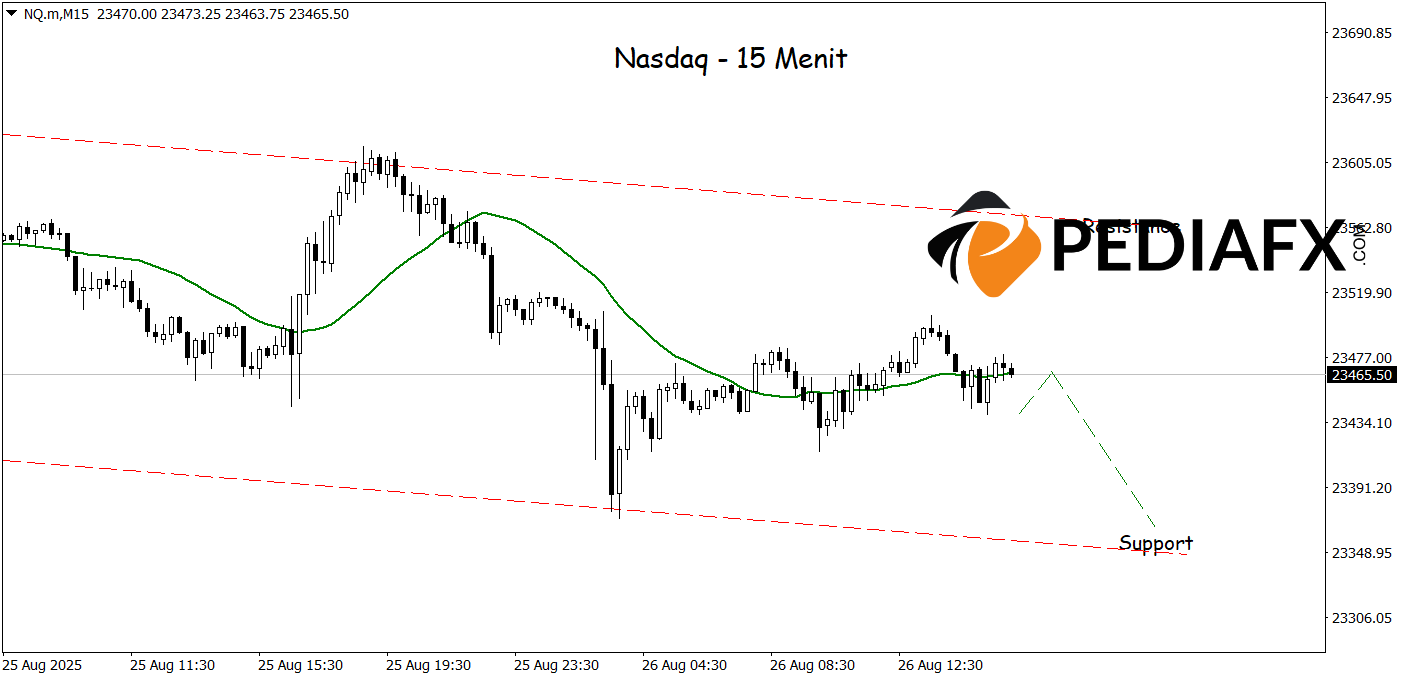
The bearish channel forming on the Nasdaq further accentuates seller dominance in the market, where the movement direction remains consistently aligned with the downward trend. Selling pressure is becoming increasingly evident with the Moving Average (MA) pointed downwards, thus strengthening signals of further weakening. With these technical conditions, the Nasdaq is positioned to continue its decline to test a significant support level at 23,360, which is currently the primary focus of price movement for tonight’s US session.
Technical Reference: sell when below 23,552
Potential Stop Loss 1: 23,522
Potential Stop Loss 2: 23,552
Potential Take Profit 1: 23,392
Potential Take Profit 2: 23,360


