

On the 1-hour chart, GBPUSD continues to exhibit a bullish trend, with a well-maintained upward trajectory. The price action forming a pattern of higher highs and higher lows (HH–HL) indicates that the buyers are still in control of the market, sustaining a positive movement direction. As long as prices remain above its dynamic support zone, selling pressure is expected to be limited, and the likelihood of a trend reversal in the near future remains relatively low.
From a technical perspective, the potential rise of GBPUSD is strengthened by a consistently upward-facing Moving Average, coupled with a ZigZag that maintains the uptrend structure. Moreover, the CCI being in the oversold area suggests a potential resurgence of buying momentum in the market. This combination of technical signals creates an opportunity for GBPUSD to continue its upward movement, coinciding with increased trading participation and volatility.
Recommended

Recommended

Recommended

Recommended
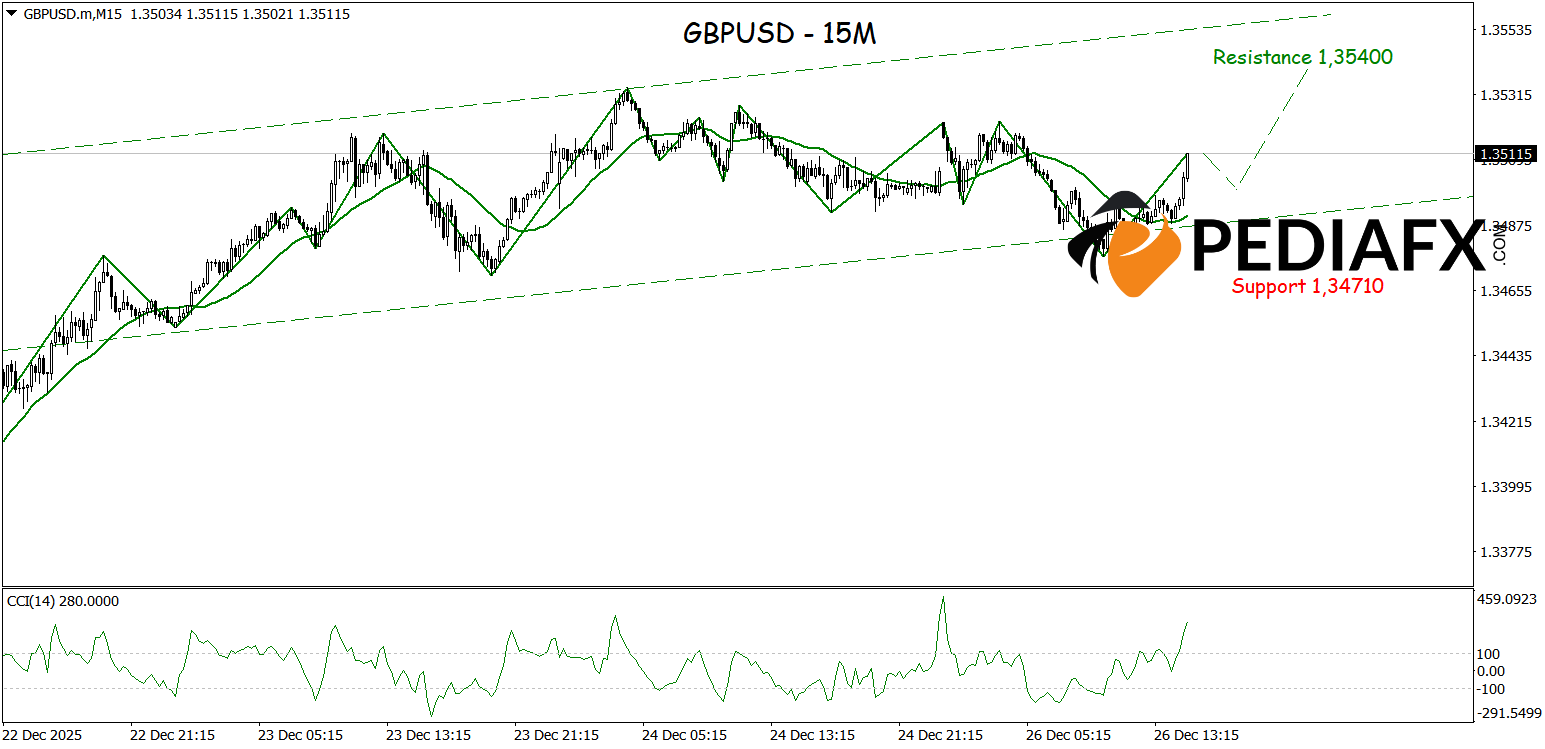
On the 15-minute chart, GBPUSD shows a renewed dominance of buyers with the consistent formation of higher highs and higher lows. The bullish-moving ZigZag and the steadily rising Moving Average confirm the positive intraday movement direction. Supported by the CCI from the oversold region, GBPUSD has the potential to continue its rise, aiming to test the resistance zone at 1.35400, provided the buying pressure remains intact.
Technical Reference: buy while above 1.34710
Potential Take Profit 1: 1.35275
Potential Take Profit 2: 1.35400
Potential Stop Loss 1: 1.34820
Potential Stop Loss 2: 1.34710


