

The USDJPY pair is demonstrating an upward trend on the hourly chart, supported by various technical indicators pointing towards a bullish direction. The Moving Average (MA) line is consistently trending upwards, reflecting a strengthening bullish sentiment. The zigzag pattern indicates a structure of higher highs and higher lows, which is a classic signal of an emerging uptrend. This scenario suggests that buyers are starting to dominate the market after a previous consolidation phase.
Moreover, the MACD indicator is positioned above the signal line and the zero zone, indicating that the momentum for increases remains intact. The expanding MACD histogram signals a potential continuation of bullish movement in the near future. With these signals from the MA, the zigzag pattern, and MACD aligning, the USDJPY appears poised to further strengthen towards key resistance levels ahead.
Recommended

Recommended

Recommended

Recommended
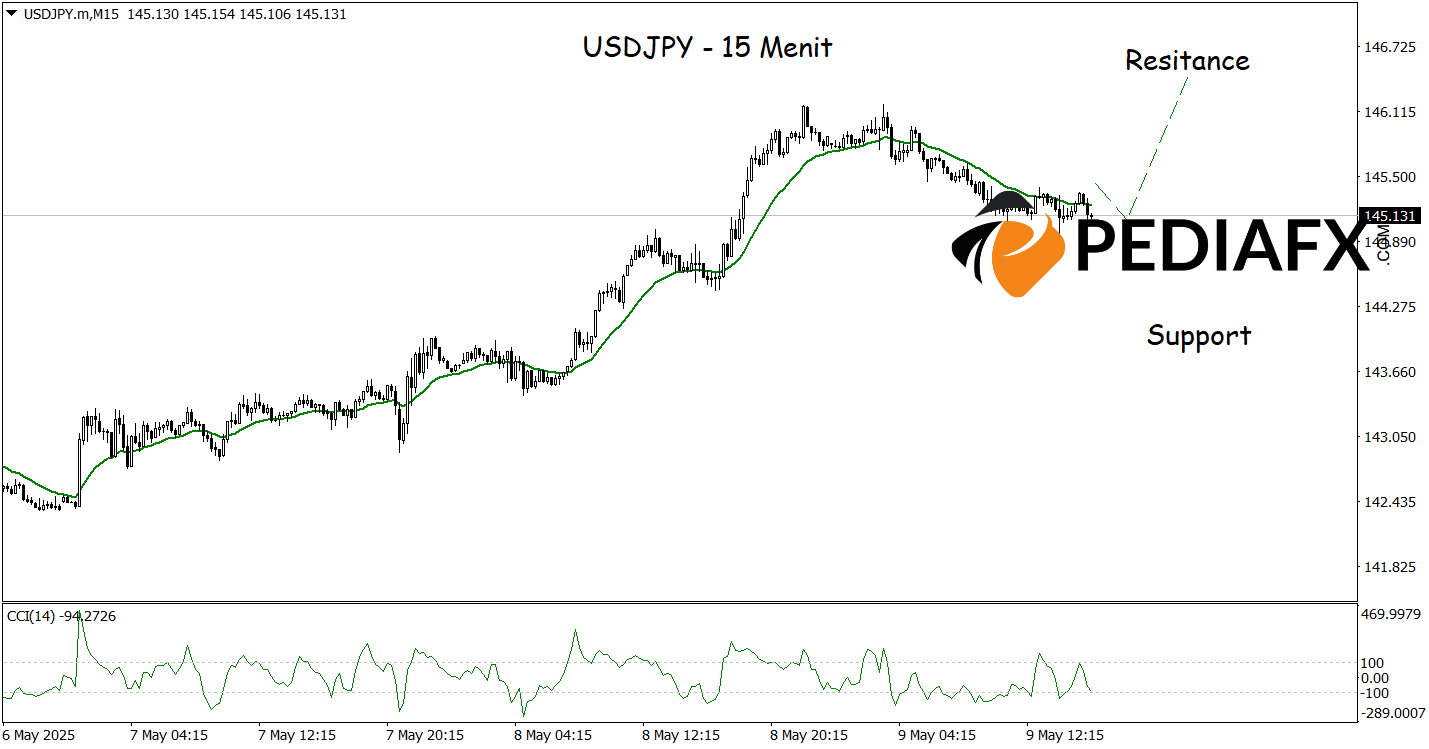
Despite experiencing a minor downward correction, the bullish structure on the 15-minute chart remains intact, as evidenced by the formation of a higher low suggesting the possibility of continued upward momentum. This is further reinforced by the Commodity Channel Index (CCI) currently being in the oversold region, indicating a potential rebound in the near term. As long as prices stay above key support areas and do not establish new lower lows, the opportunity for recovery persists, with a potential increase towards the nearest resistance at 146.395.
Technical Reference: buy above 144.110
Potential Take Profit 1: 146.020
Potential Take Profit 2: 146.395
Potential Stop Loss 1: 144.500
Potential Stop Loss 2: 144.110


