

On the 1-hour time frame, the Nasdaq index has failed to create a new high after its previous rally, indicating a weakening of buyer strength and the potential for a directional reversal. This failure demonstrates that buying pressure is insufficient to overcome the existing resistance, paving the way for a possible price correction. The ZigZag indicator is beginning to form a descending pattern, signaling weakening price structure, as the Moving Average (MA) lines start to curve downward, providing early signs of a technical correction phase.
Adding support to the weakening potential is the MACD indicator, which shows signs of declining momentum. The histogram is shrinking, and the MACD line is trending downward from positive levels, reflecting a decrease in upward momentum from the buyers. Should this selling pressure persist, the Nasdaq could continue its short-term decline, particularly if prices breach the minor support established in recent sessions. Unless a renewed upward momentum can manifest, this corrective sentiment is likely to dominate.
Recommended

Recommended

Recommended

Recommended
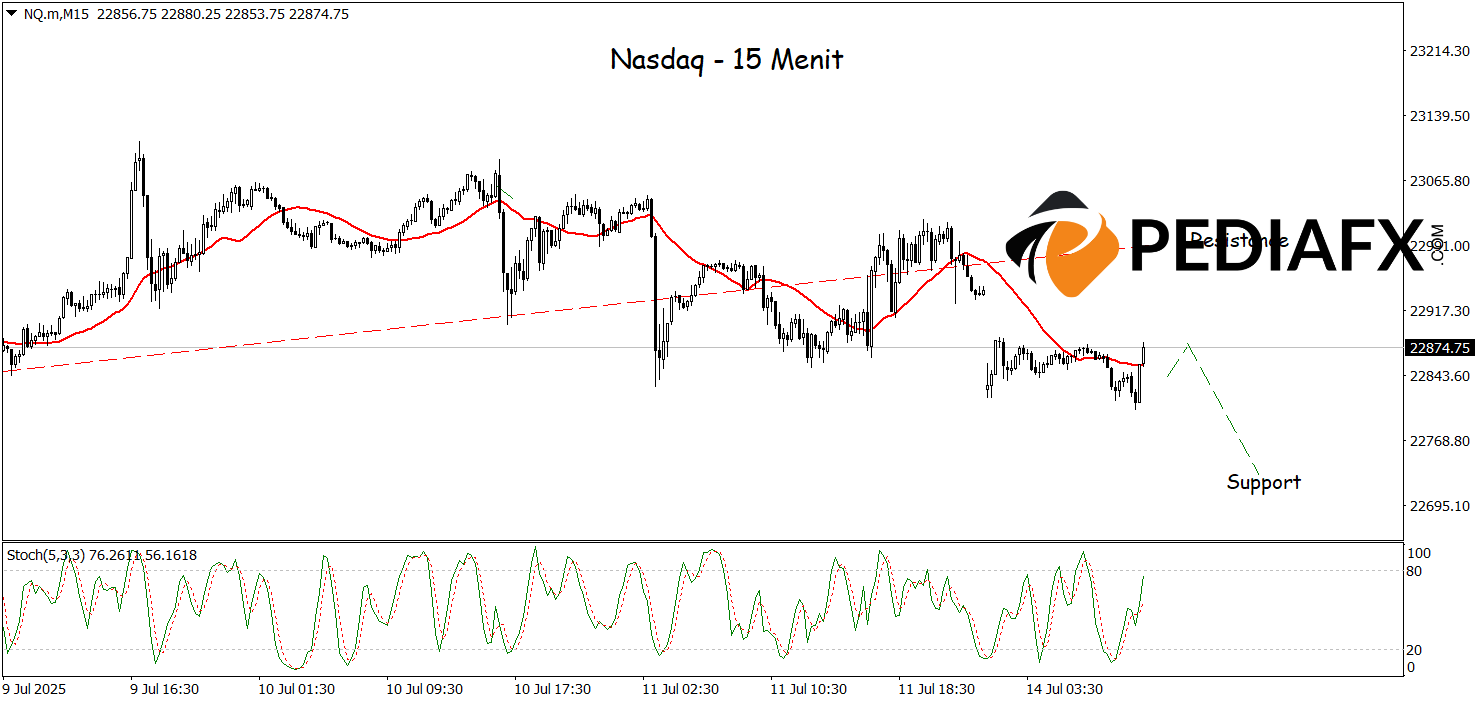
In the 15-minute time frame, the Nasdaq indicates potential for further declines as the Moving Average (MA) trends downward, suggesting that bearish pressure remains dominant. Meanwhile, the Stochastic indicator is close to the overbought area, signaling that the price may be losing its upward momentum and is at risk of correction. The combination of these two indicators reinforces the likelihood of a short-term weakening as it tests support at 22,275.
Technical Reference: sell while below 22.985
Potential Stop Loss 1: 22.945
Potential Stop Loss 2: 22.985
Potential Take Profit 1: 22.770
Potential Take Profit 2: 22.725


