

The Nasdaq index on the 1-hour chart displays signs of strengthening after the price successfully broke above the bearish trendline that had been limiting its movement. The formation of a Zigzag pattern confirms a directional shift, wherein the swing lows are increasingly rising, corresponding with the price movement above the Moving Average (MA), which now acts as a dynamic support level. This situation indicates that buying pressure is becoming more dominant, opening up opportunities for a continuation of the short-term upward trend.
The technical support is further reinforced by the positive momentum that emerged following the breakout of the trendline, where the confirmation from the MA and the Zigzag illustrates a consistent direction. If the price can maintain above the breakout area, the chances of further strengthening in the Nasdaq remain, targeting an increase towards the nearest resistance level. Conversely, if there is a rejection and the price falls below the MA, caution should be taken regarding potential short-term corrections.
Recommended

Recommended

Recommended

Recommended
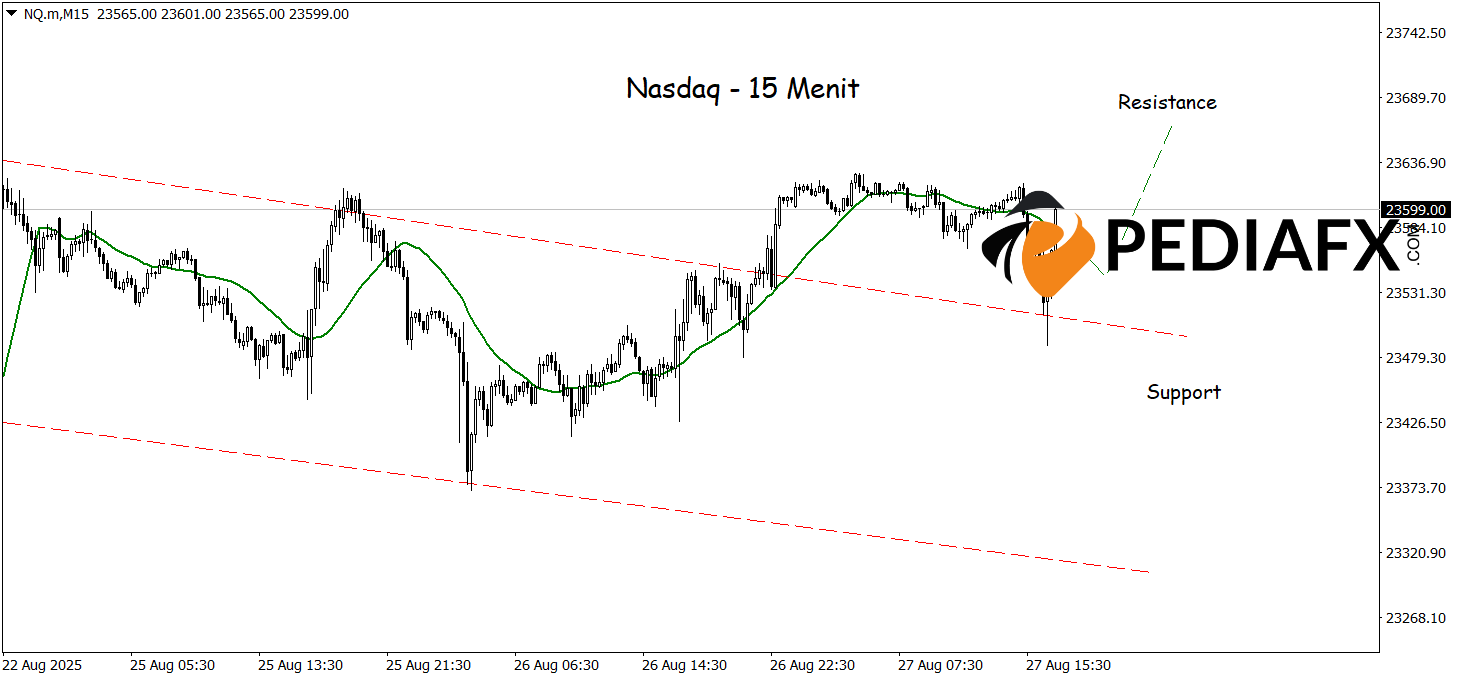
The Nasdaq shows signs of strengthening after successfully breaking a high from the bearish channel on the 15-minute timeframe, indicating a potential directional change towards a short-term upward trend. The technical signals are further strengthened by support from the Moving Average (MA), which aligns with bullish momentum, thereby broadening the possibilities for an increase. Under these conditions, the Nasdaq index has the potential to continue its rally to test the nearest resistance area at 23,670, which is a critical level for the continuation of the next strengthening trend.
Technical Reference: buy while above 23,458
Potential Take Profit 1: 23,635
Potential Take Profit 2: 23,670
Potential Stop Loss 1: 23,490
Potential Stop Loss 2: 23,458


