

The USDJPY movement on the 1-hour time frame highlights a possible trend reversal as prices have struggled to maintain their position within the ascending channel. A breakdown below the channel’s support line, accompanied by a pattern of lower highs (LH) and lower lows (LL), indicates a weakening of the previous uptrend. The blue area that was once a support zone is now acting as resistance after a pullback, confirming that selling pressure is still prevalent.
The red Moving Average indicator is also starting to curve downward, reinforcing the short-term bearish sentiment. Meanwhile, the CCI indicator, which previously reached the overbought territory, is now falling back towards neutral territory, suggesting that buying momentum is waning. As long as the price remains below the pullback zone and fails to break back above, the bearish scenario continues to dominate, with further decline potential towards the next support level.
Recommended

Recommended

Recommended

Recommended
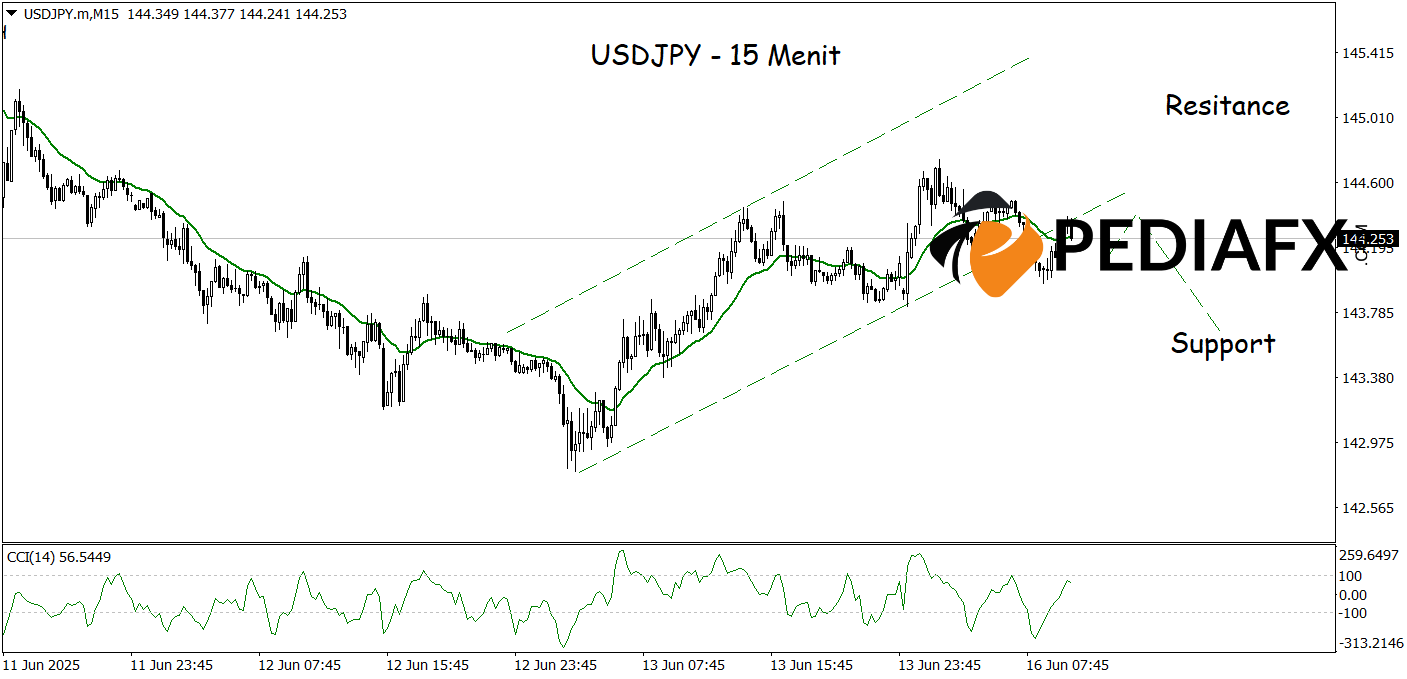
The USDJPY is showing signs of potential weakness after breaking (breaklow) the bullish channel area in the 15-minute time frame, indicating a shift in momentum from an uptrend to a corrective phase. Additional pressure is observed from the CCI indicator currently in the overbought area, increasing the likelihood of a price reversal in the near future. As long as prices remain below the broken channel zone, the bearish scenario remains intact with a decline target of 143.680.
Technical Reference: sell below 144.945
Potential Stop Loss 1: 144.700
Potential Stop Loss 2: 144.945
Potential Take Profit 1: 143.900
Potential Take Profit 2: 143.680


