

The USDJPY currency pair is starting to display signs of a trend reversal after successfully breaking through the lower boundary of the bullish channel, which previously served as support for upward movement. This breakout from that structure suggests the end of the strengthening phase and the beginning of a potential new bearish phase. This is corroborated by the formation of lower highs (LH) and lower lows (LL) on the 1-hour timeframe, characteristics typical of a downward trend. The alteration in this structure indicates that selling pressure is beginning to dominate the market, with buying actions likely to be more constrained in the short term.
From a technical analysis perspective, this condition is also supported by the Moving Average (MA) line, which has started to trend downward, providing a visual confirmation that the trend’s strength is shifting in favor of sellers. Meanwhile, the MACD indicator is also in the negative zone, indicating that bearish momentum is developing and the potential for further declines remains significant. As long as the price is unable to reclaim the nearest resistance levels, USDJPY is at risk of continuing to weaken towards the next support levels, in line with the market’s shifting sentiment towards a more defensive outlook.
Recommended

Recommended

Recommended

Recommended
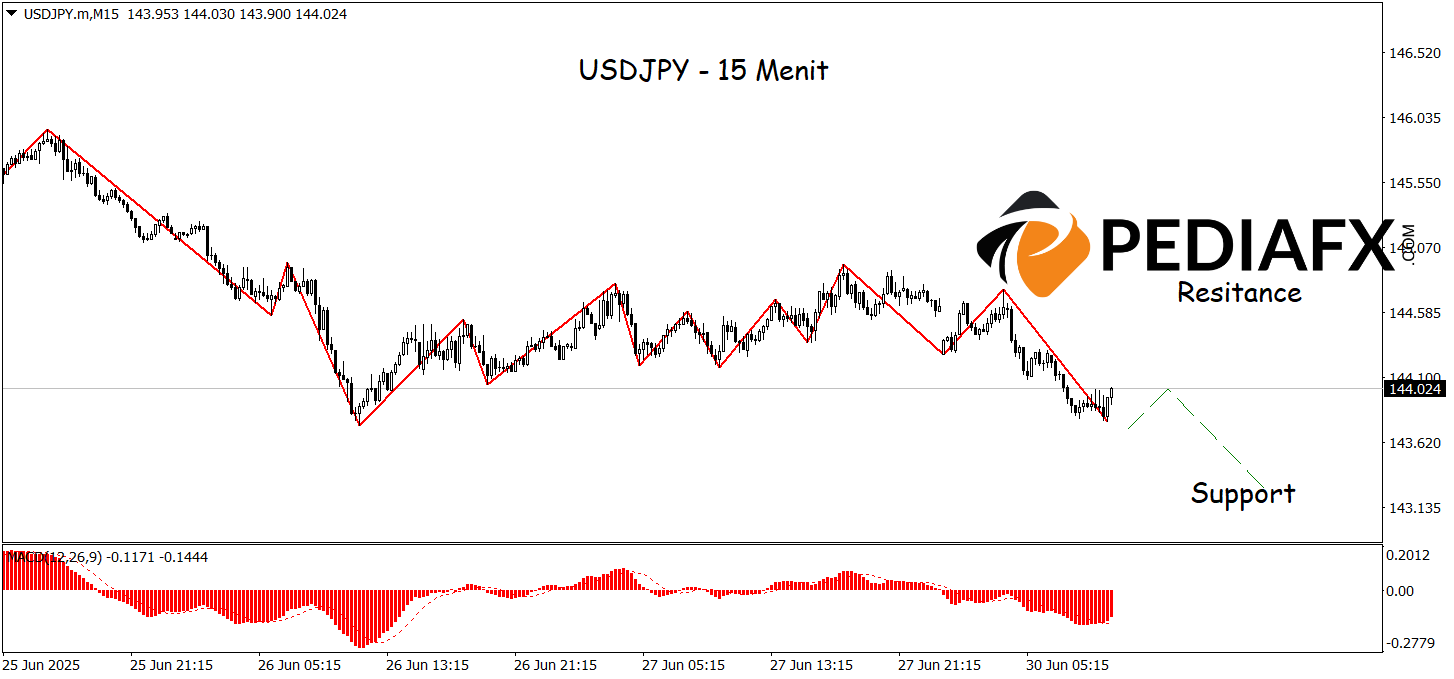
The USDJPY pair has the potential to further apply bearish pressure on the 15-minute timeframe, indicated by confirmation from the ZigZag indicator forming a pattern of lower highs and lower lows, demonstrating a market structure that tends to weaken. Additionally, the MACD indicator remains in the negative zone, signaling that selling momentum is still dominant, with a potential target near the support level of 143.295.
Technical References: sell as long as it stays below 144.595
Potential Stop Loss 1: 144.365
Potential Stop Loss 2: 144.595
Potential Take Profit 1: 143.525
Potential Take Profit 2: 143.295


