

The 1-hour chart for USDJPY illustrates a complex price movement dynamic, with a shift in trends from bullish to bearish and the potential for an upward reversal. Initially, the price was moving within an ascending channel characterized by higher highs (HH) and higher lows (HL), showing a strong bullish trend. However, a break below the lower channel marked an early signal of weakening. Subsequently, the price structure formed lower highs (LH) and lower lows (LL), indicating a dominant downtrend until early July.
Interestingly, towards the end of the chart, a structure emerged that could indicate an early reversal signal. After establishing a new low (L), the price managed to break through a minor resistance level and form HH and HL, signaling a potential trend change from bearish to bullish. The price movement has also started to position itself above the EMA, and the MACD indicator is reflecting positive momentum. Should the price maintain the most recent HL and establish a new HH, a confirmation of the upward trend is likely, creating opportunities for short-term buy positions with stringent risk management.
Recommended

Recommended

Recommended

Recommended
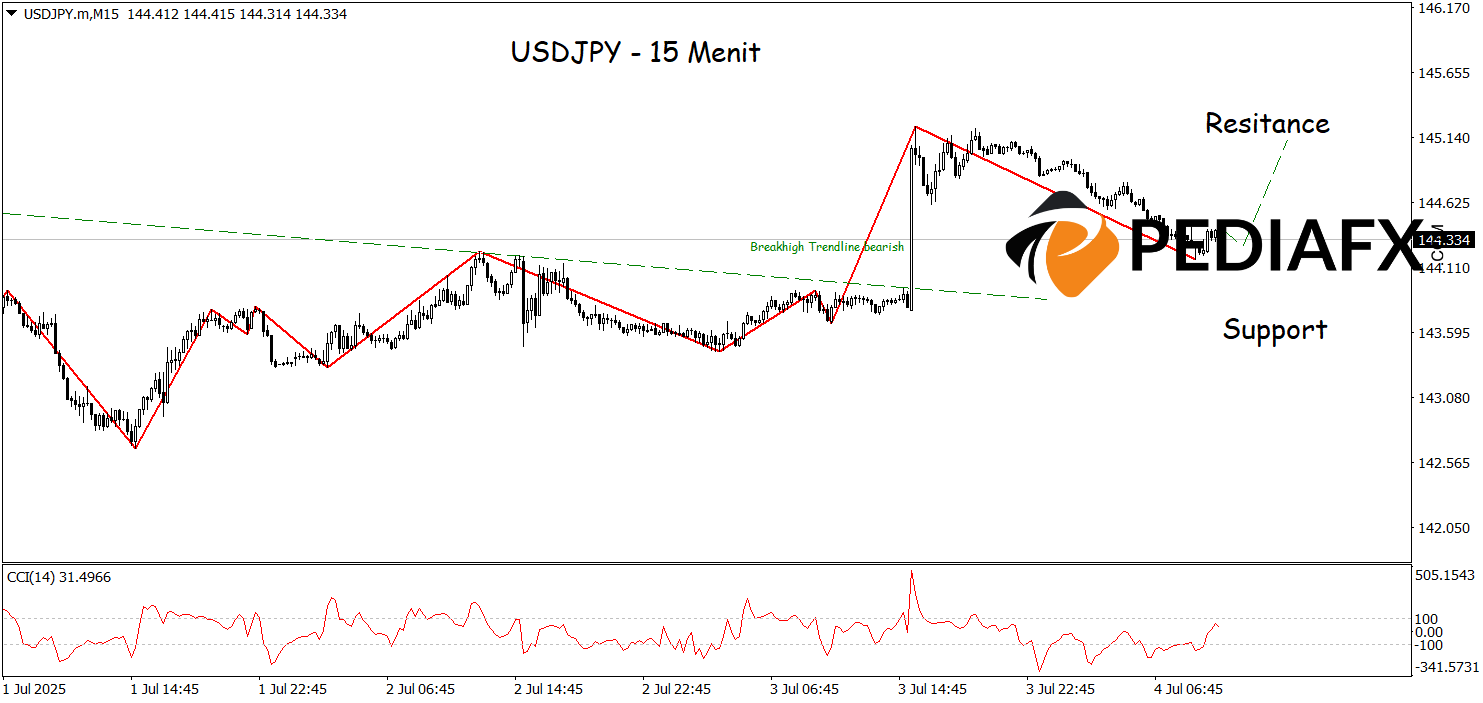
USDJPY is signaling promising technical indicators after successfully breaking through the bearish trendline on the 15-minute timeframe, suggesting a possible change in direction from downward pressure to an upward trend. The CCI indicator is also starting to rise from the oversold area, reinforcing the short-term price recovery signals. This combination of a breakout and technical momentum opens up opportunities for USDJPY to continue strengthening, with the next target aiming for the nearest resistance level at 145.140.
Technical Reference: buy while above 143.685
Potential Take Profit 1: 144.900
Potential Take Profit 2: 144.140
Potential Stop Loss 1: 143.890
Potential Stop Loss 2: 143.685


