


The USDJPY pair is beginning to show signs of pressure within the low bullish channel on the 1-hour chart, indicating a potential weakening of the current trend structure. This technical condition is further reinforced by the position of the Moving Average (MA), which is now situated above the current price, suggesting that selling momentum is gradually taking control. If the price fails to maintain its position within the channel support area, the likelihood of a further decline increases.
Additionally, the OsMA indicator, which has started to shift into the negative territory, adds more bearish pressure on the USDJPY. This signal reflects a weakening buyer force and could accelerate a shift in price direction. Should selling pressure persist, the pair is at risk of testing the next support level, while a failure to break through the channel support might trigger a consolidation phase before a clearer trend direction emerges.

Recommended

Recommended

Recommended

Recommended
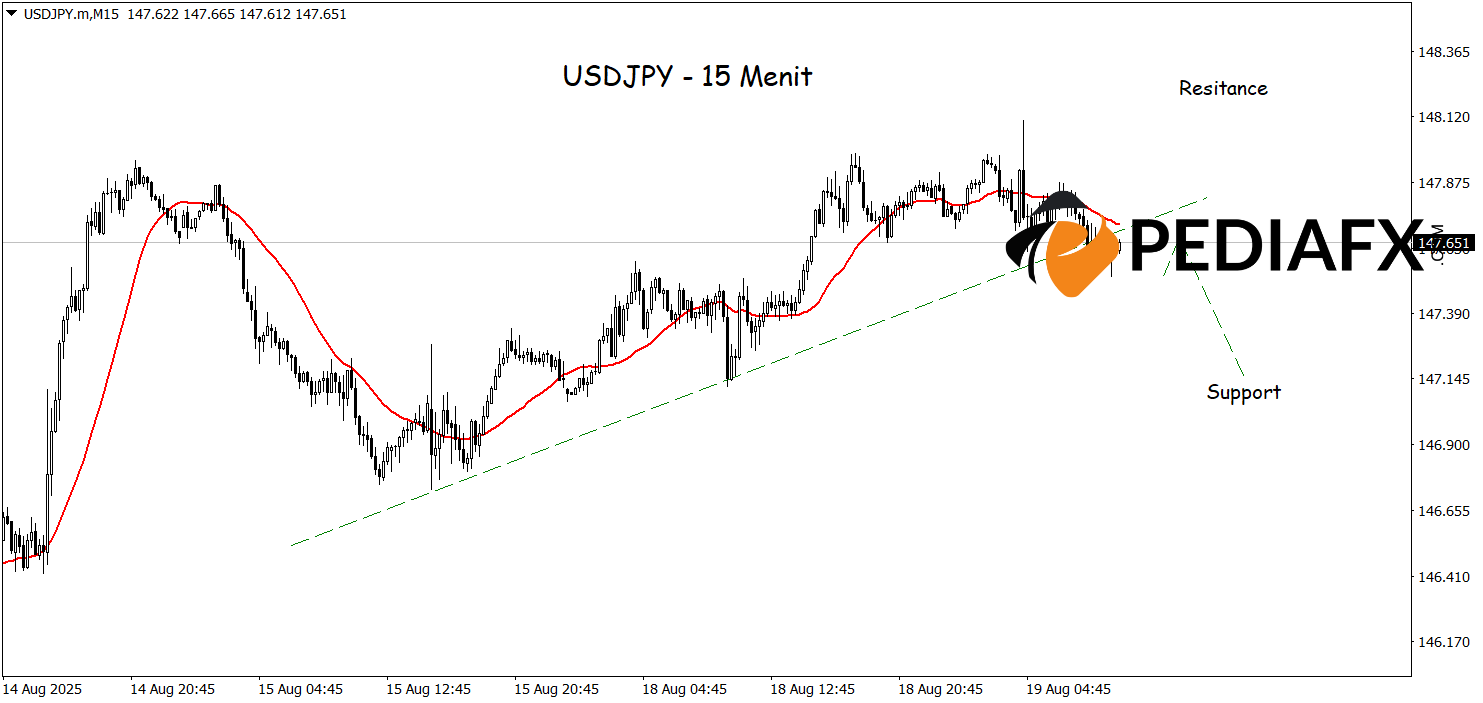
The USDJPY has encountered pressure following a breaklow on the bullish trendline in the 15-minute chart, coupled with the MA indicating a downward trajectory, serving as additional confirmation of price weakening. This technical scenario opens up opportunities for further declines, with the nearest target potentially testing the low at 147.145 as the next crucial support level.
Technical Reference: sell while below 148.160
Potential Stop Loss 1: 147.970
Potential Stop Loss 2: 148.160
Potential Take Profit 1: 147.310
Potential Take Profit 2: 147.145








