

The USDJPY currency pair is signaling a strong prospective decline after forming a descending triangle pattern on the hourly chart. This pattern indicates persistent selling pressure, highlighted by repeatedly tested support levels, suggesting a potential breakdown if this support fails to hold. The declining price structure is further corroborated by the Moving Average (MA) indicator, which shows a bearish posture as prices remain below the primary MA line, indicating dominant selling momentum.
Additionally, the MACD indicator provides further validation with the MACD line positioned below the signal line and a widening negative histogram, suggesting an increase in selling pressure. The combination of the descending triangle formation along with signals from the MA and MACD reinforces the bearish outlook for USDJPY in the short to medium term.
Recommended

Recommended

Recommended

Recommended
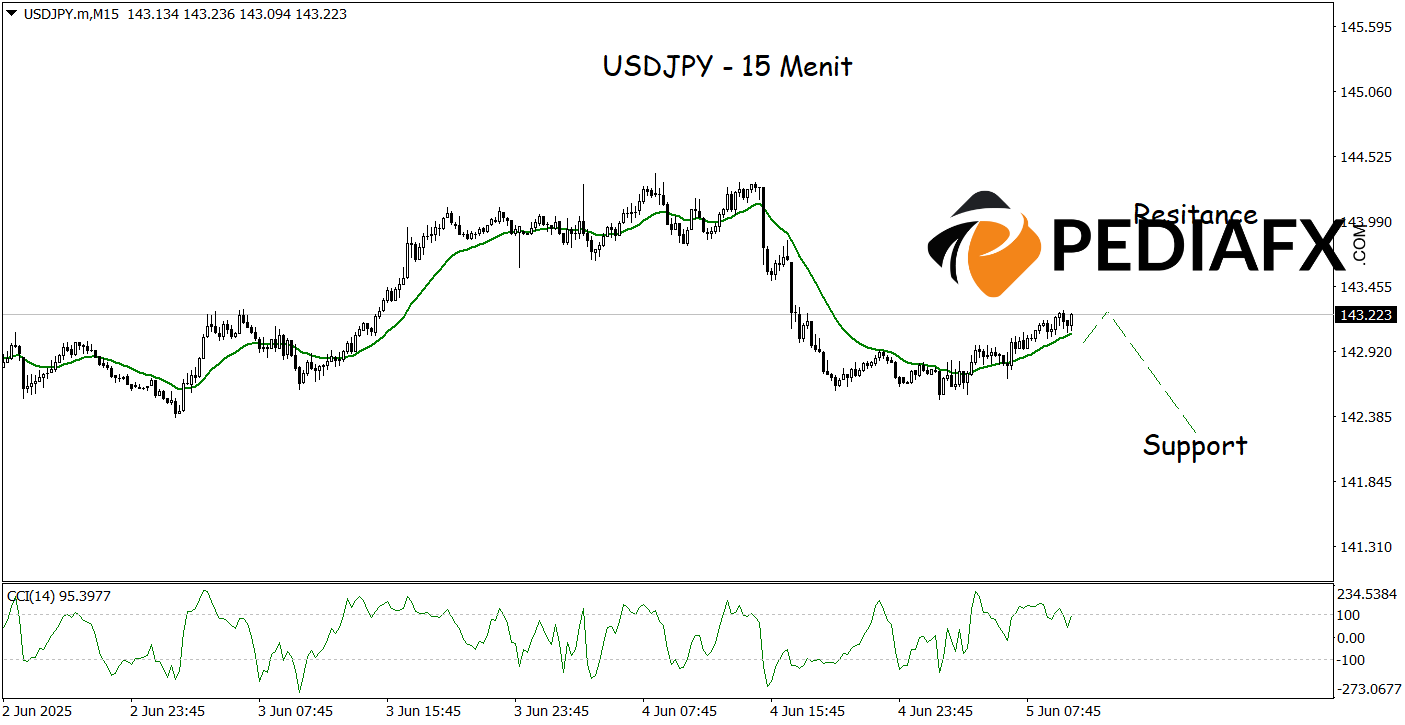
USDJPY appears poised for a short-term decline as the Moving Average (MA) begins to slope downwards on the 15-minute time frame, indicating a weakening upward momentum. Concurrently, the Commodity Channel Index (CCI) is in an overbought condition, typically signaling that buying pressure has peaked and a correction or downward reversal is likely to test the 142.260 level.
Technical Reference: sell while below 143.970
Potential Stop Loss 1: 143.675
Potential Stop Loss 2: 143.970
Potential Take Profit 1: 142.470
Potential Take Profit 2: 142.260


