


The USDJPY currency pair is exhibiting increasingly strong bearish signals following its breach of the support zone in the symmetrical triangle pattern on the hourly chart. This decline is marked by the formation of new lower lows, indicating that selling pressure remains dominant. The pullback that occurred after the drop has only reinforced the continuation of the downward trend, as buyers have failed to maintain momentum above the previous support level.
Additional confirmation is provided by the downward movement of the Moving Average (MA) indicator, which aligns with the current downtrend. This situation increases the likelihood of USDJPY continuing its decline to lower levels in the near future. As long as the price remains beneath the breakout triangle and the MA trend is downward, the short-term outlook for this pair appears to be bearish.

Recommended

Recommended

Recommended

Recommended
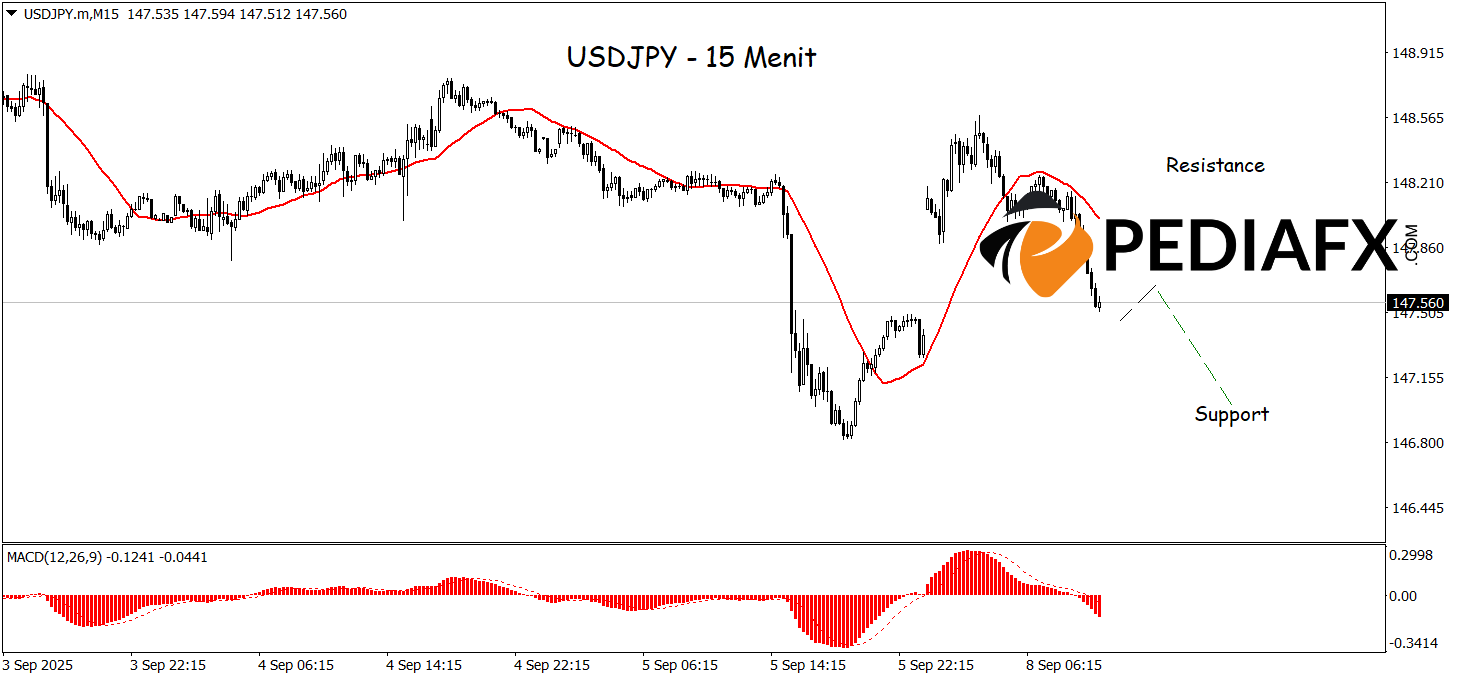
On the 15-minute chart, the bearish dominance of USDJPY is becoming increasingly evident, with the MA sharply pointing downward and additional confirmation coming from the MACD, which is positioned in negative territory, further strengthening the selling momentum. This technical condition suggests that downward pressure remains dominant, with a significant potential for USDJPY to continue its weakness and test the crucial support level at 146.980 in the near term.
Technical Reference: Sell while below 148.250
Potential Stop Loss 1: 148.035
Potential Stop Loss 2: 148.250
Potential Take Profit 1: 147.260
Potential Take Profit 2: 146.985








