

The USDJPY currency pair has shown a significant directional shift after successfully breaking through the lower support level of the bearish channel that has constrained its price movement. This breakout has effectively undermined the dominance of buyers that had previously driven prices higher. Currently, the price structure is forming a Lower High (LH) and Lower Low (LL), which indicates that a downward trend has now assumed control on the 1-hour time frame. This structural shift serves as an early signal that the market is beginning to enter a distribution phase, with increasing selling pressure.
The technical support for this bearish scenario is further reinforced by a downward curving Moving Average (MA) indicator, alongside the MACD situated in negative territory with diverging lines. Both indicators provide consistent signals that the downward momentum remains strong. Unless there is a significant reversal and prices stay below the key resistance level, USDJPY may continue to weaken in the near term, with the next downside target located around a lower technical support area.
Recommended

Recommended

Recommended

Recommended
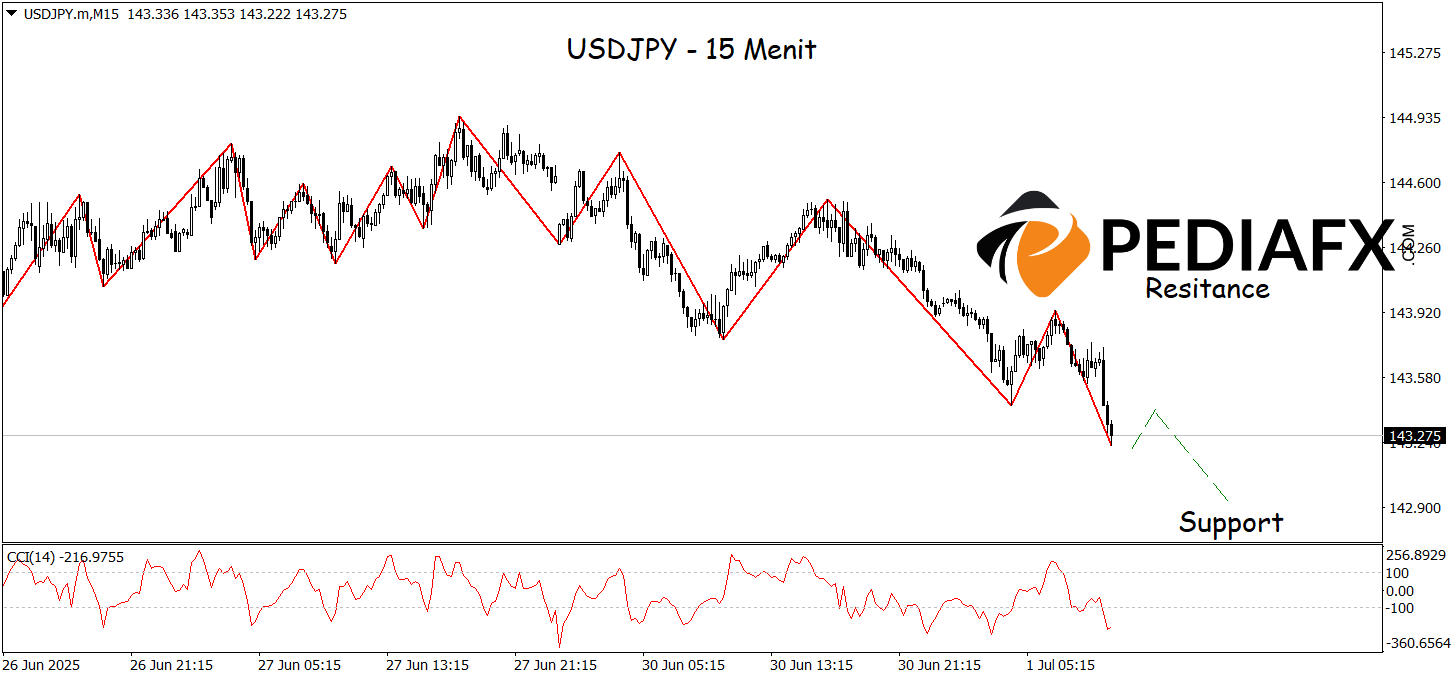
In the short term, USDJPY shows potential for further declines, as indicated by the Zigzag indicator forming a bearish pattern with a Lower High and Lower Low structure on the 15-minute time frame. Selling pressure has become more apparent after the CCI indicator sharply fell from overbought territory, signaling a shift in momentum from bullish to bearish. This combination of signals reflects that sellers remain in control, and unless a breakout occurs to the upside, USDJPY is viewed as positioned to continue its decline toward the nearest support level of 142.900.
Technical Reference: sell while below 143.655
Potential Stop Loss 1: 143.515
Potential Stop Loss 2: 143.655
Potential Take Profit 1: 143.050
Potential Take Profit 2: 143.900


