

The movement of USDJPY in the 1-hour time frame reveals signs of weakening in the bullish trend after the price breached the lower boundary of the bullish channel that has confined price movements since late May. The market structure, which previously formed a pattern of Higher High (HH) and Higher Low (HL), now shows signs of disruption, indicated by the price’s inability to maintain its position within the channel. Increasing selling pressure has driven USDJPY down past a dynamic support, and the MACD indicator also confirms the negative momentum with the histogram moving deeper into the negative territory.
This breach might signal the beginning of a reduction in buyer dominance, increasing the likelihood of a trend reversal. As long as the price remains below the support level, which has now turned into resistance, the chance for further corrections towards the next support zone remains viable.
Recommended

Recommended

Recommended

Recommended
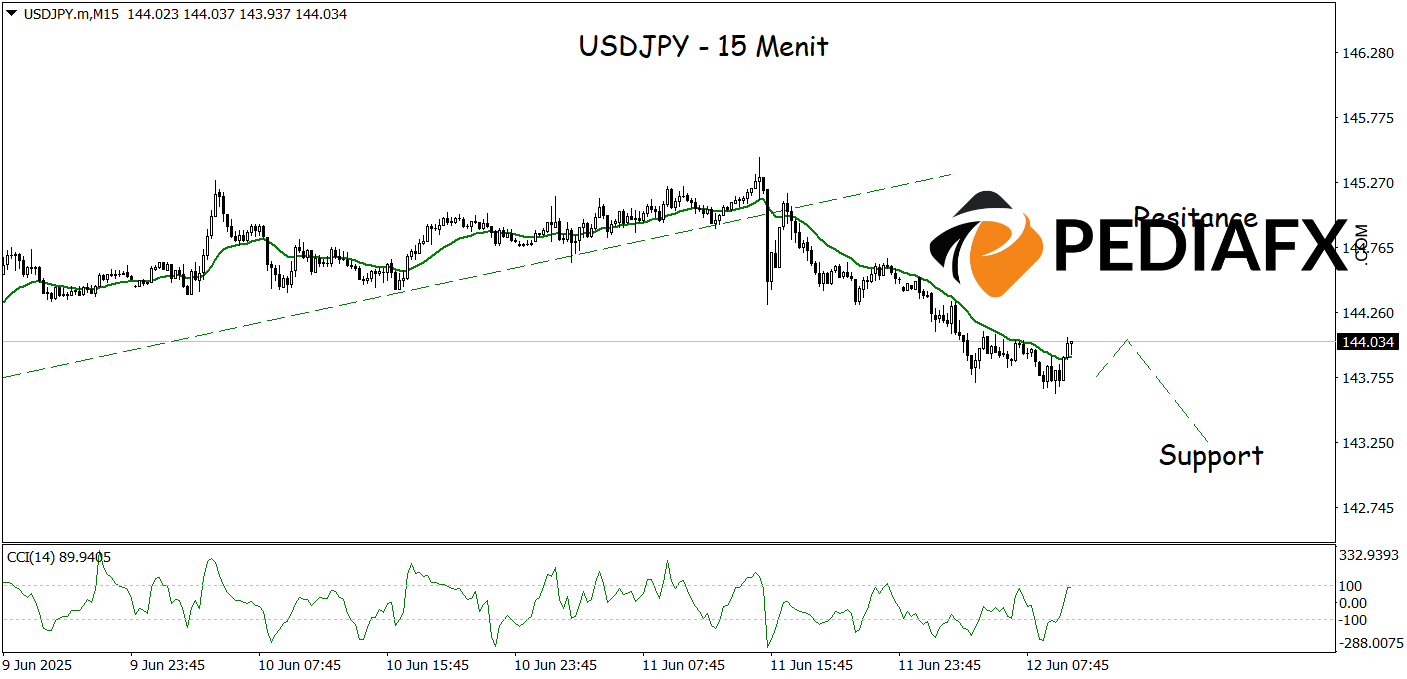
The USDJPY movement in the 15-minute time frame shows signs of a pullback after breaking through the upward trendline that was previously acting as a dynamic support. The CCI indicator approaching overbought levels suggests a potential rise in selling pressure. If the price fails to break this resistance, the likelihood of further declines towards the support area around 143.250 becomes significant.
Technical Reference: sell while below 144.845
Potential Stop Loss 1: 144.525
Potential Stop Loss 2: 144.845
Potential Take Profit 1: 143.485
Potential Take Profit 2: 143.245


