

The USDJPY currency pair displays signs of a potential trend reversal after successfully breaking through the upper boundary, followed by a correction towards the middle line of the Bollinger Bands. This pullback to the mid-level indicates that the market is searching for equilibrium before committing to its next direction. This scenario is further intensified by the occurrence of a higher low pattern, which could signal an early indication of a trend reversal.
The Stochastic indicator, currently residing in the oversold region, boosts the likelihood of a trend change. This condition suggests that selling momentum has diminished, allowing buyers to gradually re-enter the market. Should this indicator start to show upward movement from the oversold level, USDJPY is poised for further gains.
Recommended

Recommended

Recommended

Recommended
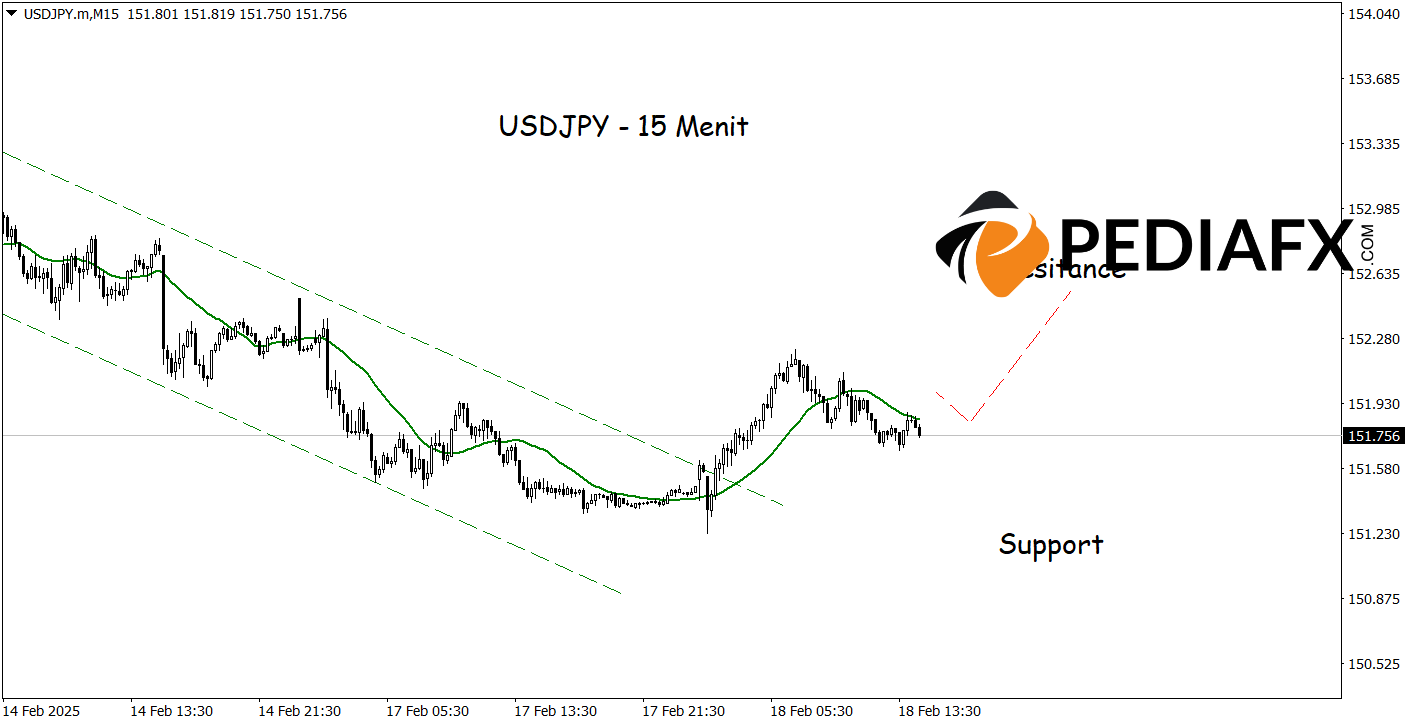
The USDJPY indicates potential upward movement after breaking out of the bearish channel on the 15-minute chart, suggesting a possible short-term trend change. This breakout signifies a weakening of selling pressure and the beginning of buyer dominance. Furthermore, with prices now above the Moving Average (MA), the chances for a bullish test of the resistance level at 152.560 are strengthened.
Technical Reference: buy as long as it remains above 151.255
Potential Take Profit 1: 152.345
Potential Take Profit 2: 152.560
Potential Stop Loss 1: 151.480
Potential Stop Loss 2: 151.255


