

The movement of the USDJPY currency pair indicates a strengthening decline as three technical indicators confirm a bearish sentiment. The ZigZag indicator has identified a lower high and a lower low, indicating the formation of a downward market structure. Additionally, the USDJPY price is currently trading below the Moving Average (MA) line, reflecting a prevailing selling pressure in the short term. The MA’s flattening also reinforces the notion that any potential rise is becoming increasingly limited, thus creating room for further declines.
Moreover, the MACD indicator is providing a clear bearish signal, with its line trending downwards and crossing below the signal line. The widening negative gap in the MACD histogram further confirms that the downward momentum is gaining strength. With these three technical signals aligning, the outlook for USDJPY suggests a potential for further decline towards the next support level.
Recommended

Recommended

Recommended

Recommended
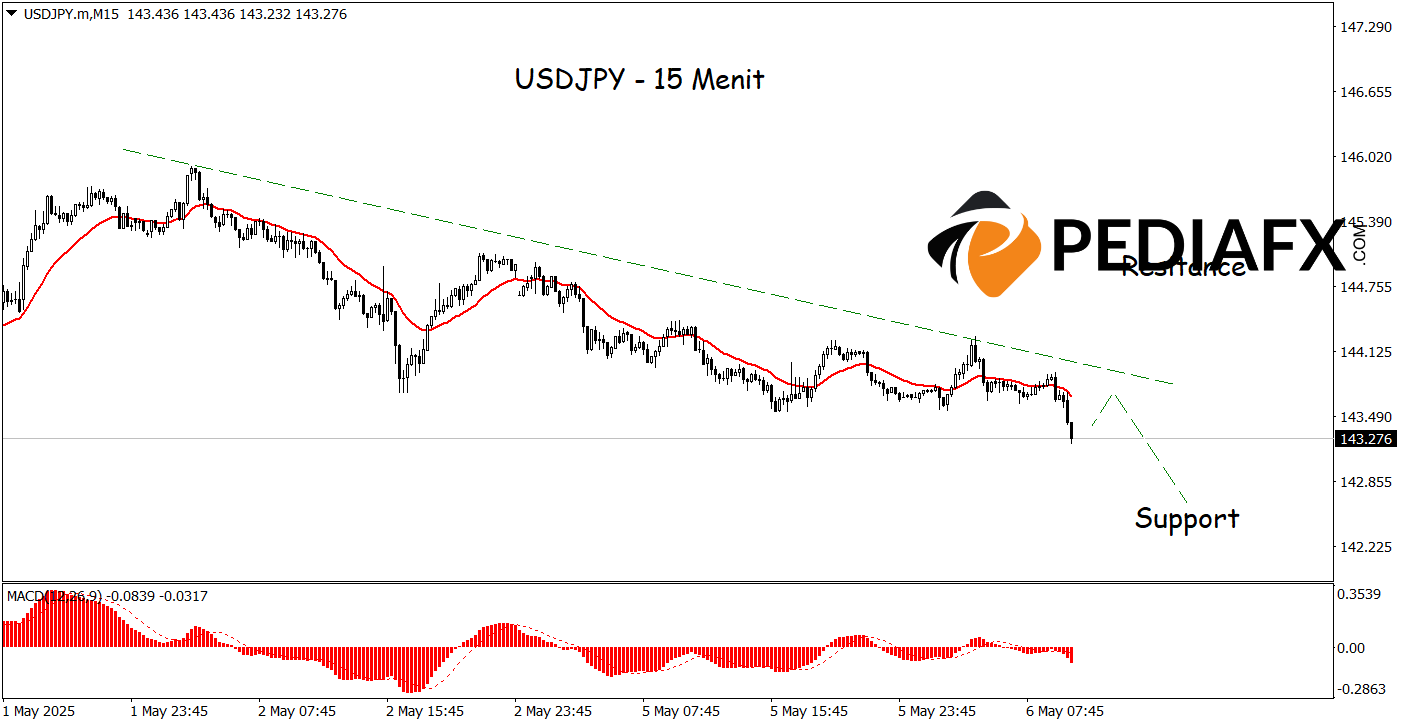
On the 15-minute time frame, the currency pair exhibits a significant downward trend following the formation of a clear bearish trendline, indicating that prices are moving in a declining pattern. The Moving Average (MA) is currently trending downwards, strengthening the signal that selling pressure dominates the market. Additionally, the MACD indicator is confirming the potential for a decline, with the MACD line moving lower and crossing beneath the signal line, while the MACD histogram continues to record widening negative bars. The combination of these three elements suggests an increased likelihood of price declines on the 15-minute timeframe testing the level of 142.600.
Technical References: sell while below 144.775
Potential Stop Loss 1: 144.360
Potential Stop Loss 2: 144.775
Potential Take Profit 1: 143.050
Potential Take Profit 2: 142.600


