

The USDJPY chart on the 1-hour timeframe displays a robust upward trend that has been in place since early July 2025. After reaching a lower low (LL) at the end of June, the price started to establish higher lows (HL) and higher highs (HH), indicating a shift in trend from bearish to bullish. The upward channel (denoted by the dashed green line) reinforces the consistent movement within the upper and lower boundaries of this trend. The ongoing emergence of HL and HH points illustrates strong buyer momentum, with each correction being contained at levels higher than those previously established.
In the latest session, the price successfully broke through the upper boundary of the upward channel with a strong surge towards 148.548. This breakout is supported by the MACD indicator showing a positive histogram that is beginning to widen, signaling a reinforcing bullish momentum. If the price manages to hold above the channel and does not revert to the previous area, there is potential for further strengthening towards the next resistance zone.
Recommended

Recommended

Recommended

Recommended
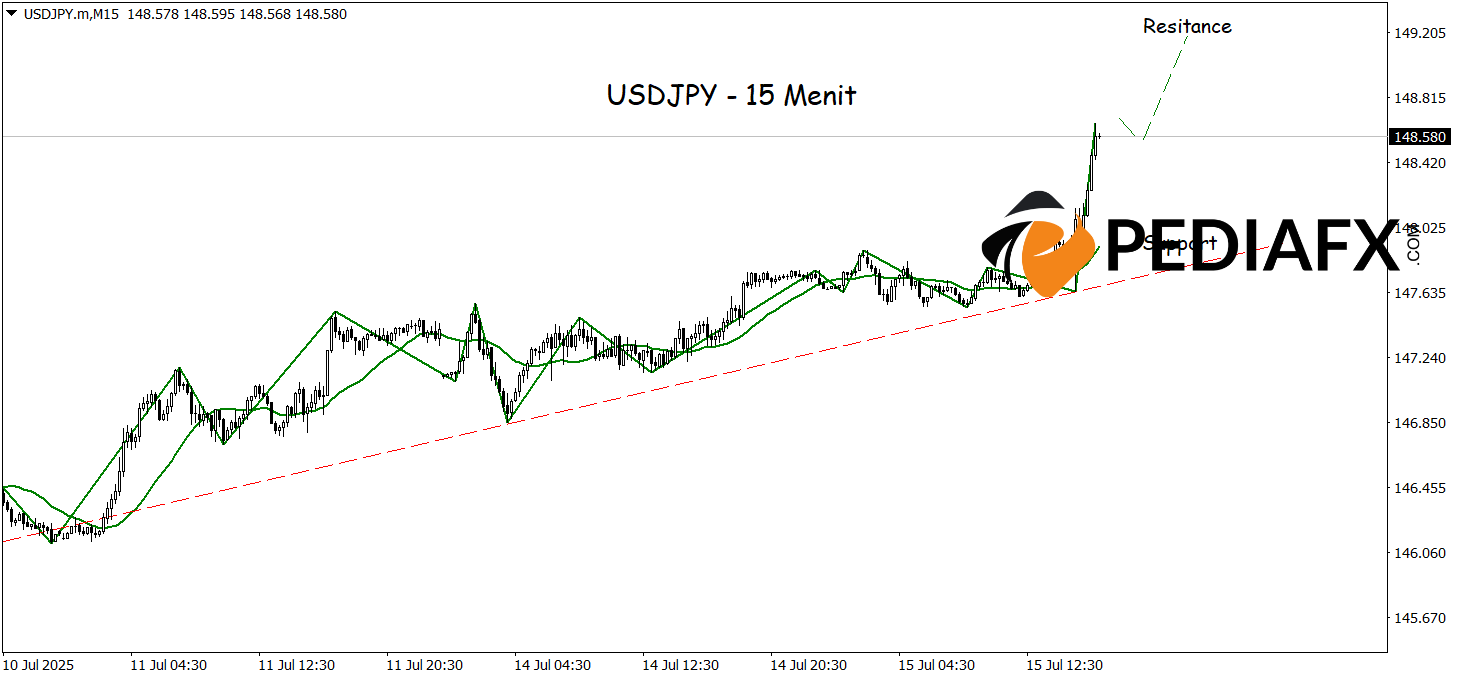
The movement of USDJPY on the 15-minute timeframe suggests the potential for a continuation of the upward trend, bolstered by a formation of a bullish trendline that consistently withstands selling pressure. As the European session begins, the ZigZag indicator starts to form a pattern of higher highs and higher lows, highlighting a strengthening price structure. Meanwhile, the upward direction of the Moving Average (MA) further reinforces the technical signal that buying momentum is regaining strength. With this technical support, USDJPY has a favorable chance of continuing its rise in the near term to test the resistance area at 149.180.
Technical Reference: buy while above 147.955
Potential Take Profit 1: 148.945
Potential Take Profit 2: 149.180
Potential Stop Loss 1: 148.200
Potential Stop Loss 2: 147.955


