

The technical condition of the Nasdaq index on the 1-hour time frame is still displaying a strong upward tendency, supported by a solid and stable bullish channel. Prices are consistently moving in a pattern of higher highs and higher lows, indicating that the bullish trend is ongoing. The Zigzag indicator confirms this direction with a sequence of peaks and troughs that are steadily rising, while the Moving Average (MA) line trending upwards serves as evidence that buyers are still dominating the market.
Additional technical signals emerge from the Stochastic Oscillator, which has started to rise from the oversold territory, suggesting an initial return of buying pressure in the short term. This response strengthens the likelihood of continued upward momentum soon. As long as prices remain above the dynamic support line of the MA, the potential for gains remains wide open, focusing on movement toward the nearest resistance level.
Recommended

Recommended

Recommended

Recommended
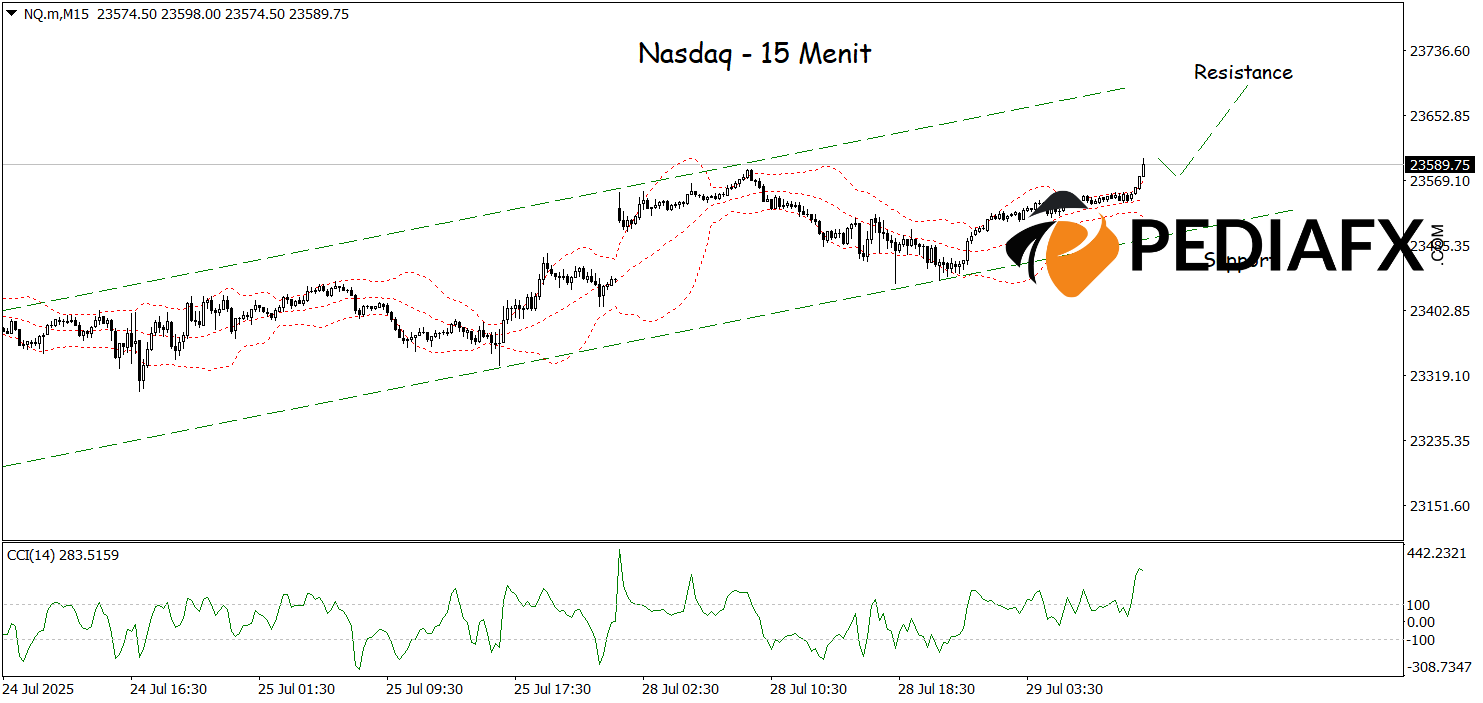
The Nasdaq exhibits robust bullish strength on the 15-minute time frame, having successfully breached the upper resistance of the Bollinger Bands (BB) while maintaining its position within the intact bullish channel. This breakout serves as a continuation signal that buying pressure remains dominant, supported by a price structure that keeps moving upward. As long as the dynamic support holds, there are significant opportunities for Nasdaq to continue its upward trend, with the next resistance target situated around 23,692.
Technical Reference: buy as long as above 23,478
Potential Take Profit 1: 23,650
Potential Take Profit 2: 23,692
Potential Stop Loss 1: 23,516
Potential Stop Loss 2: 23,478


