

The Nasdaq is displaying signs of a sustained upward trend after successfully remaining within a solid bullish channel. The technical setup increasingly supports the momentum, with the Zigzag indicator beginning to create a pattern of higher highs and higher lows, indicating a robust buying push. Additionally, the upward trajectory of the Moving Average (MA) provides further confirmation that buying pressure continues to dominate in the short term.
The CCI indicator, which is beginning to rebound from oversold territory, further strengthens the positive signal, suggesting that the previous selling pressure is easing, thus paving the way for a potential upward reversal. If this pattern persists, the Nasdaq could continue its ascent towards the next resistances, with the technical bias remaining favorably bullish in the upcoming sessions. Traders are advised to monitor the breakout zones and potential confirmation signals to optimize risk management.
Recommended

Recommended

Recommended

Recommended
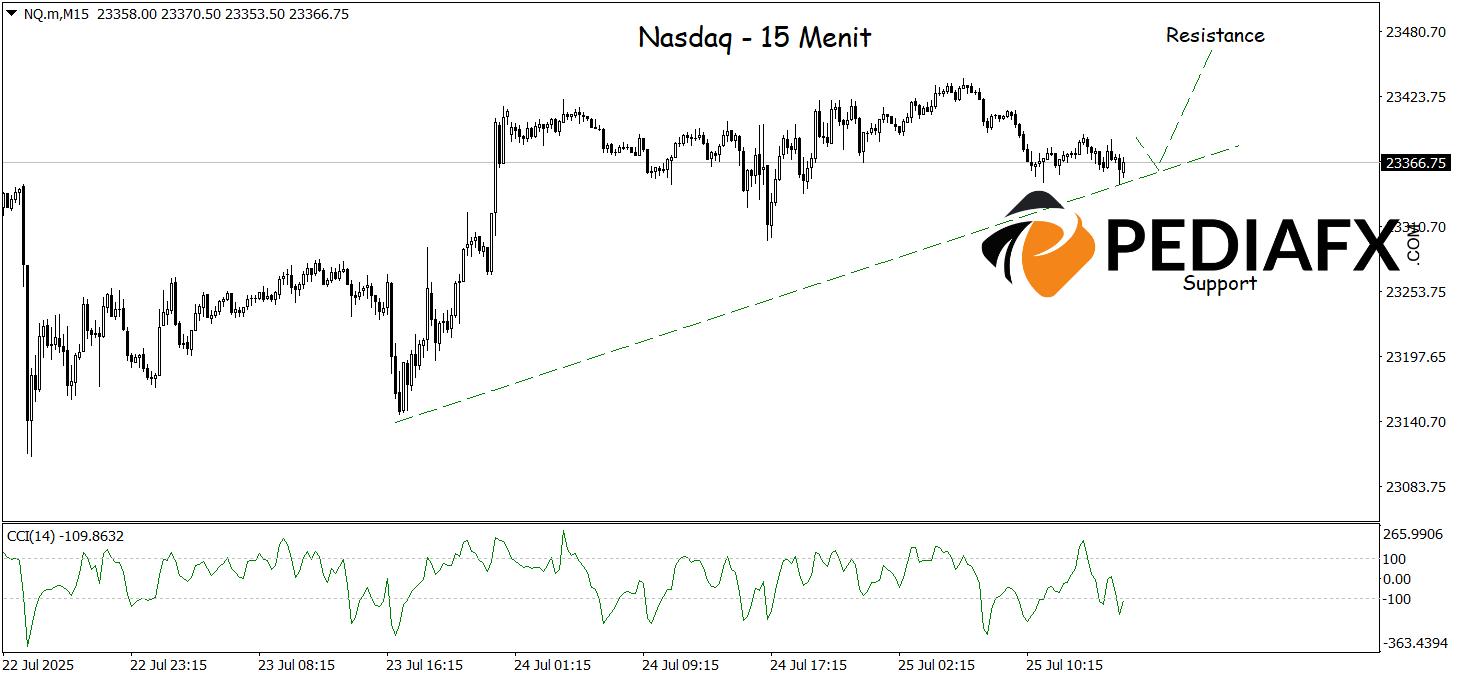
In the short term, the chance of a rebound is also present after the Nasdaq successfully broke through the bearish trendline on the 15-minute time frame. Currently, prices are positioned at the lower region of the Bollinger Bands, which often acts as a starting point for upward reversals. Moreover, the CCI indicator highlights oversold conditions, signaling a loss of momentum in selling pressure. This combination presents an opportunity for the Nasdaq to regain strength and test resistance around 23,465.
Technical Reference: buy above 23,272
Potential Take Profit 1: 23,435
Potential Take Profit 2: 23,465
Potential Stop Loss 1: 23,307
Potential Stop Loss 2: 23,272


