

The Nasdaq index is currently exhibiting a robust bullish channel on the hourly chart, indicating sustained strength from buyers in the US market this evening. The formation of Higher Lows (HL) and Higher Highs (HH), supported by the ZigZag indicator, confirms that the upward trend remains intact. This movement suggests that buyers continue to dominate, thereby maintaining a steadfast bullish bias amidst market fluctuations.
Technical support can also be observed from the upward trajectory of the Moving Average (MA) as well as the MACD remaining in positive territory, signaling that the upward momentum is still present. This combination of signals bolsters the potential for an extended rally, with the Nasdaq likely to test or even break through the nearest resistance level.
Recommended

Recommended

Recommended

Recommended
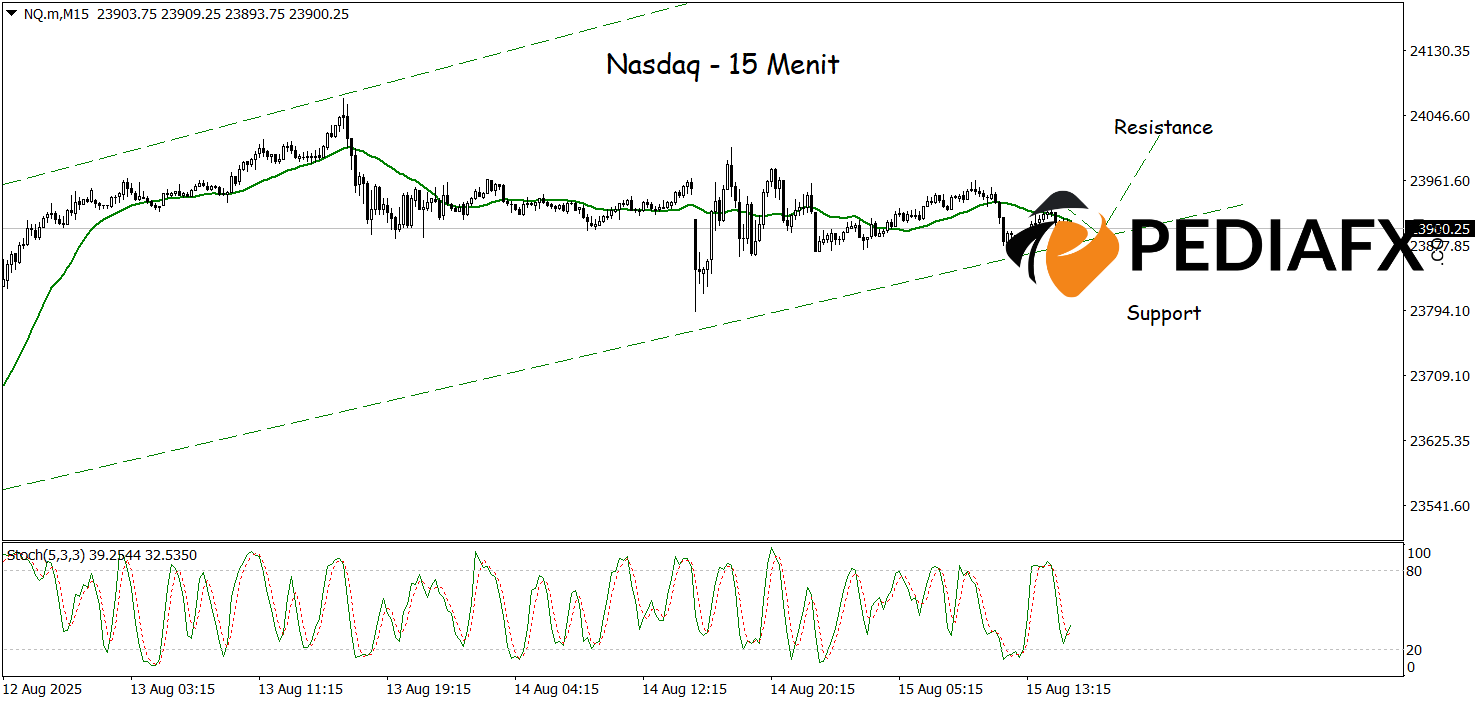
On the 15-minute chart, the Nasdaq is still navigating within a bullish channel, with the MA showing a slight flattening yet still leaning upwards. Additionally, the Stochastic indicator, currently in the oversold zone, provides further impetus for potential strength, presenting a good opportunity for the Nasdaq to test resistance around 24,013.
Technical Reference: buy as long as it remains above 23,799
Potential Take Profit 1: 23,968
Potential Take Profit 2: 24,013
Potential Stop Loss 1: 23,836
Potential Stop Loss 2: 23,799


