

The bearish trend on Nasdaq remains strong, with clear indications that selling pressure is likely to persist within the 1-hour timeframe. The current price structure is forming a consistent bearish channel, reflecting a stable market control by sellers. The downward trend in the ZigZag pattern and Moving Average reinforces the formation of lower highs and lower lows, indicating that buyers have failed to reverse the existing momentum.
This scenario technically confirms that the primary trend is still under the control of sellers, and any potential upward correction will only be temporary as long as prices remain below the upper limit of the resistance channel.
Recommended

Recommended

Recommended

Recommended
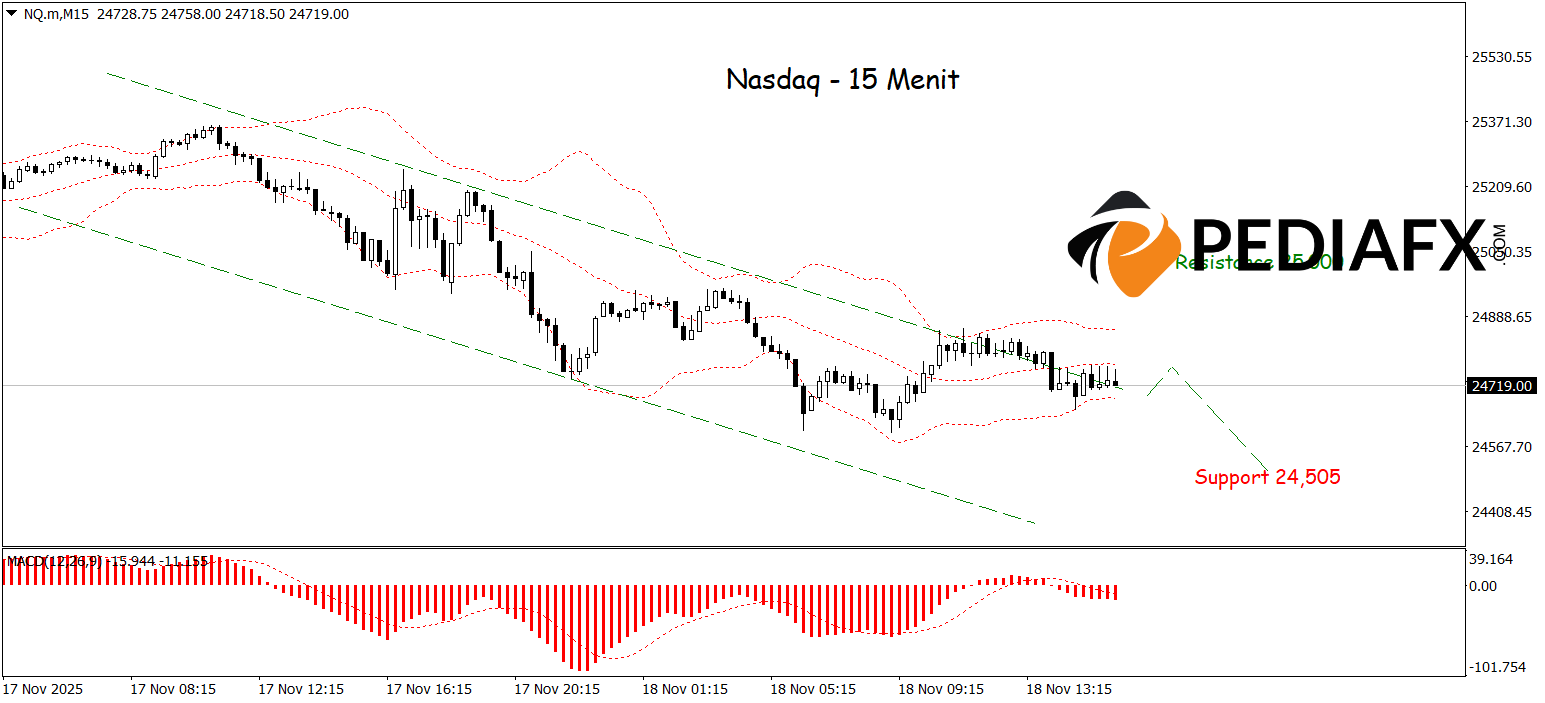
The momentum confirmation is strengthened by the MACD indicator consistently remaining in negative territory, signaling that the bearish momentum is still robust and has not shown significant weakening. On the 15-minute chart, the consistency of the bearish channel is becoming increasingly apparent, supported by widening Bollinger Bands towards the lower side, indicating a rise in selling volatility. Given this convergence of technical signals, the short-term outlook for Nasdaq points toward a continuation of the decline to test the crucial support level at 24,505.
Technical Reference: sell when below 25,000
Potential Stop Loss 1: 24,920
Potential Stop Loss 2: 25,000
Potential Take Profit 1: 24,610
Potential Take Profit 2: 24,505


