

The Nasdaq has been subjected to significant selling pressure after breaking below the low of a bullish channel, which has confirmed the emergence of a bearish pattern on the 1-hour chart. This movement indicates a loss of control by the buyers, with an increasing dominance of sellers pushing prices to lower levels. This technical structure serves as a crucial signal that a corrective trend is underway and could persist in the near future.
The bearish signal is further supported by technical indicators. The sharply declining Moving Average (MA) enhances the downward pressure, while the ongoing formation of new lower lows in the ZigZag pattern strengthens the indication of weakness. With this combination of factors, the Nasdaq is likely to continue its decline towards the next support area, keeping the market under the shadow of a bearish trend in the short term.
Recommended

Recommended

Recommended

Recommended
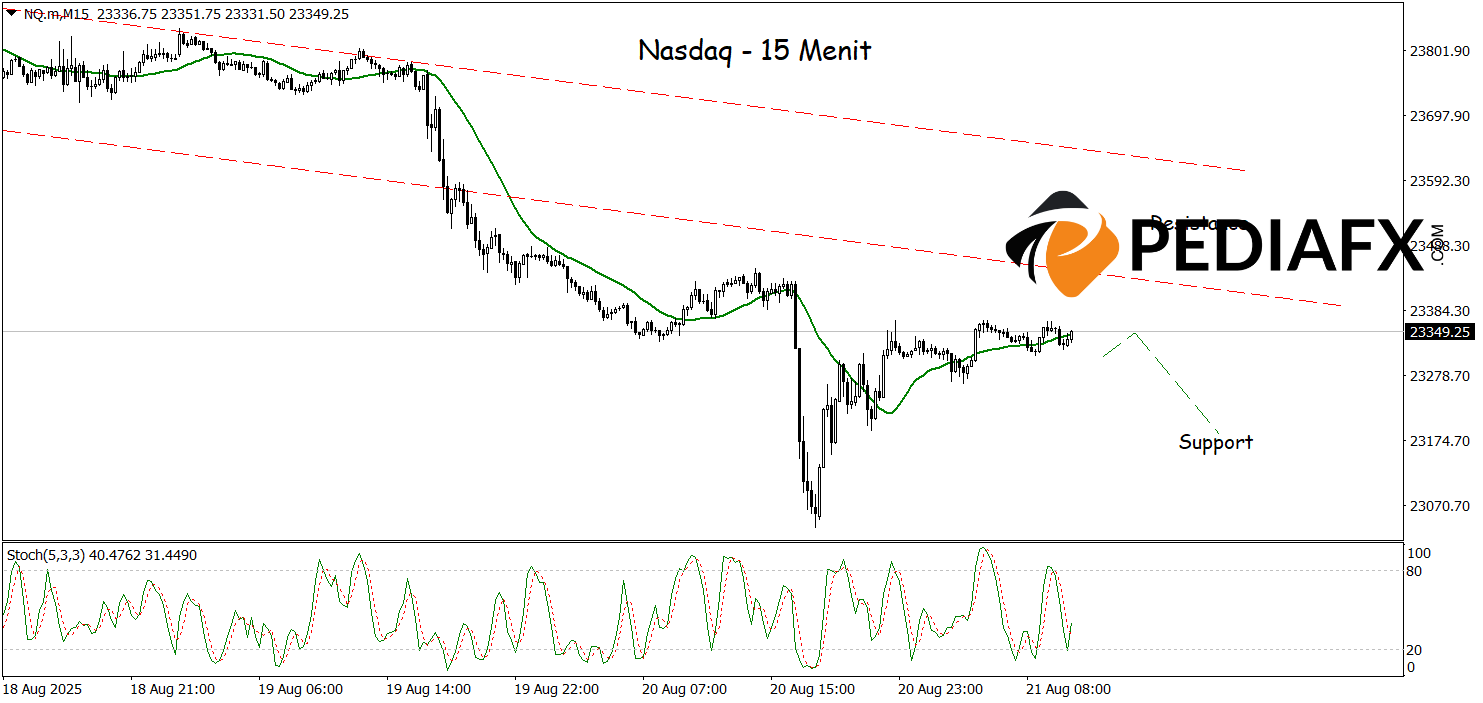
On the 15-minute timeframe, the Nasdaq increasingly displays selling pressure following a breaklow in the bearish channel, establishing a new low. This price structure underscores the dominance of sellers, while the stochastic indicator retreating from overbought territory provides additional signals that the downward momentum may continue. Given these technical factors, the Nasdaq is poised to extend its weakness and test significant support levels around 23,180.
Technical Reference: sell below 23,505
Potential Stop Loss 1: 23,450
Potential Stop Loss 2: 23,505
Potential Take Profit 1: 23,235
Potential Take Profit 2: 23,2180


