


The GBPUSD movement on the hourly chart continues to show a strong presence of sellers after the price broke through the lower boundary of the bearish channel that has been in place for the past two weeks. This decline serves as a strong confirmation of an ongoing downtrend, with the price structure consistently forming Lower Lows. The lack of buying reaction at the temporary support area indicates that the potential for a rebound remains limited. This situation underscores that market sentiment leans towards a bearish outlook, where selling pressure remains the dominant force driving the price movement.
From a technical perspective, the signs of a downturn are further supported by the downward trends in the Moving Average (MA) and ZigZag indicators, indicating that the bearish momentum is still active. Additionally, the Commodity Channel Index (CCI) is currently in the overbought territory, which could lead to the emergence of new selling pressure soon. This combination of indicators suggests that the strength of buyers is insufficient to reverse the trend, which keeps the possibility of continued declines considerably high.

Recommended

Recommended

Recommended

Recommended
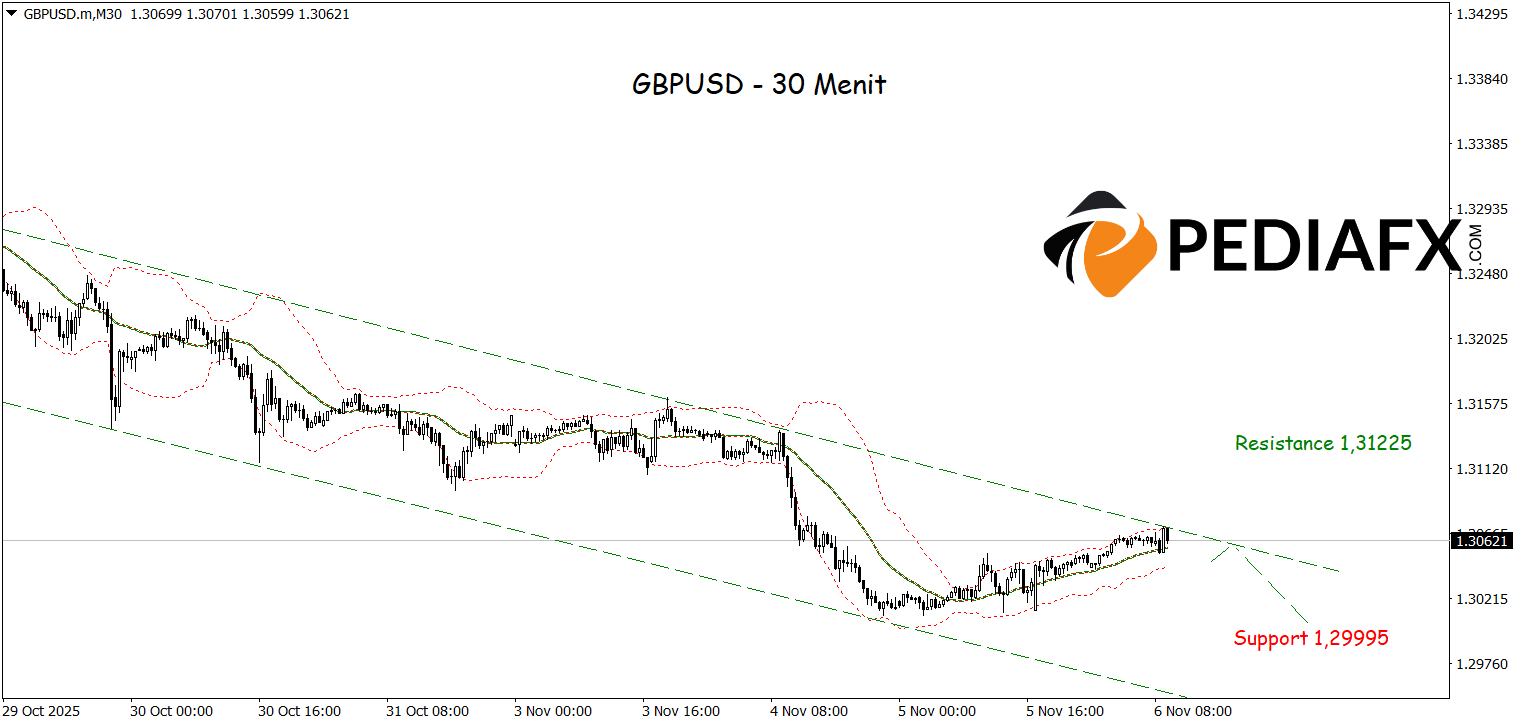
On the 15-minute timeframe, GBPUSD appears to be weakening again around the upper resistance of the Bollinger Bands (BB), suggesting that new selling pressure is emerging in the market. The price movement pattern that continues to follow a bearish structure reaffirms that the seller dominance is far from over. If the price fails to break through this resistance area during the European session today, the potential for a decline is likely to continue, aiming to test the nearest support level around 1.29995.
Technical Reference: sell while below 1.31225
Potential Stop Loss 1: 1.31035
Potential Stop Loss 2: 1.31225
Potential Take Profit 1: 1.30200
Potential Take Profit 2: 1.29995








