

On the 1-hour chart, the Nasdaq indicates early signs of a reversal as the price successfully breaks through the bearish resistance channel high. This breakout signifies a reduction in the dominance of selling pressure that previously restricted price movements, while simultaneously opening up the potential for the Nasdaq to enter a recovery phase. As long as the price remains above the breakout level, market bias is likely to shift towards bullish, allowing for a more sustained upward movement.
From a technical perspective, the strengthening potential is further supported by the Moving Average and ZigZag indicators that are showing upward trends, reflecting healthier upward structure formation. Furthermore, the MACD moving within positive territory indicates a strengthening buying momentum. This combination of signals supports the scenario of continued price increases, with the Nasdaq likely to test nearby resistance levels soon.
Recommended

Recommended

Recommended

Recommended
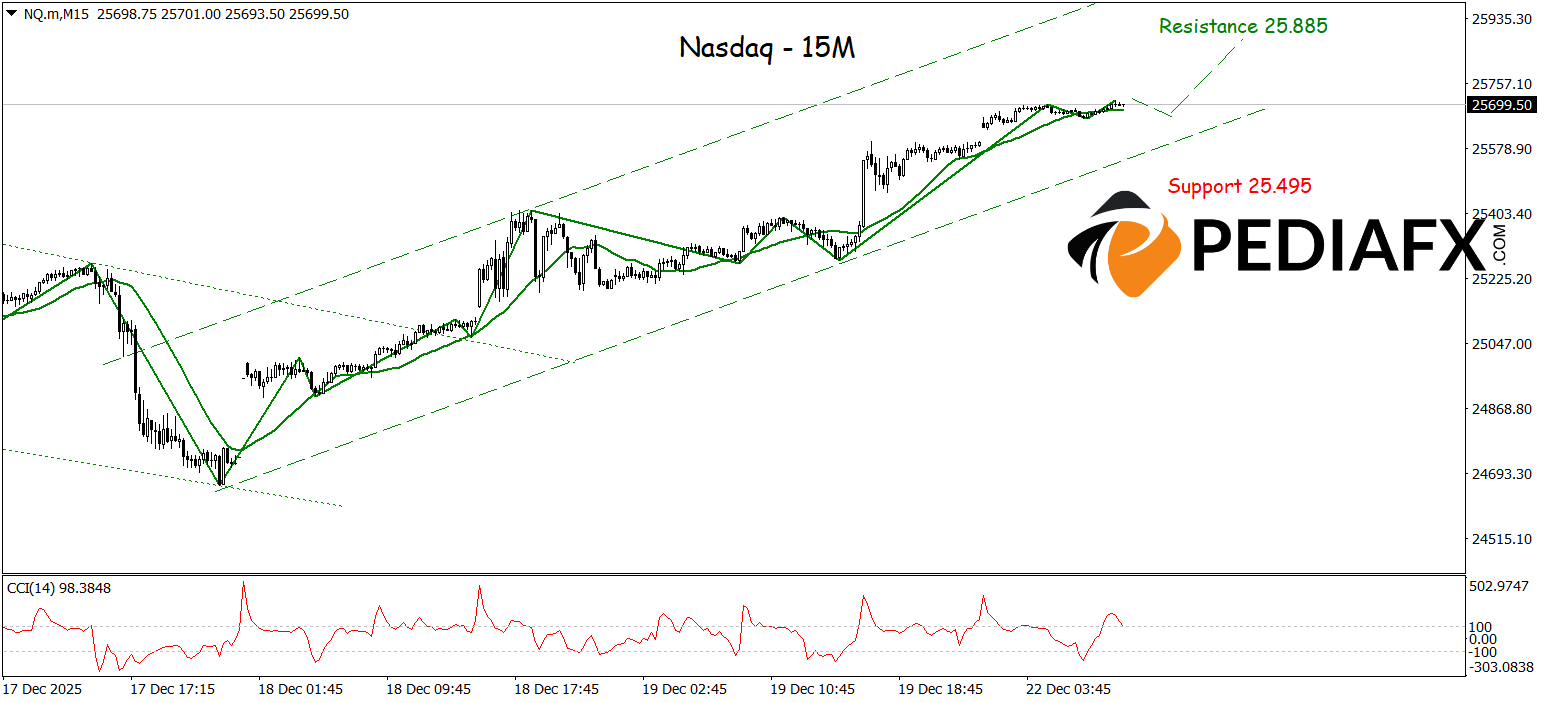
Meanwhile, on the 15-minute chart, the Nasdaq reaffirms a bullish bias as the price breaks through the bearish resistance channel high and begins to form a bullish channel pattern. This condition reflects the return of buyer dominance in the short term. As long as the price holds above the nearest support level and bullish momentum is maintained, the Nasdaq has the potential to continue strengthening to test the resistance area around 25,885.
Technical Reference: buy while above 25,495
Potential Take Profit 1: 25,790
Potential Take Profit 2: 25,885
Potential Stop Loss 1: 25,587
Potential Stop Loss 2: 25,595


