

The USDJPY currency pair is showing signs of weakness once again after being rejected from the Bollinger Bands (BB) resistance level and failing to break through the middle BB area on the 1-hour chart. This repeated rejection from these two critical technical levels indicates that selling pressure is beginning to dominate the market. Furthermore, the price structure that has not formed a new higher high reinforces the signal that the previous bullish momentum is starting to lose strength, thereby opening the door for a potential continuation of the downward trend in the near term.
From a technical perspective, the MACD indicator residing in the negative territory further emphasizes the bearish short-term outlook. This situation reflects an increasing dominance of sellers, while buyers appear to be losing control over the price movement direction. As long as USDJPY remains below the BB resistance area, the potential for continued downward pressure remains significant, with the next target heading towards the nearest support area, alongside the strengthening bearish momentum in the market.
Recommended

Recommended

Recommended

Recommended
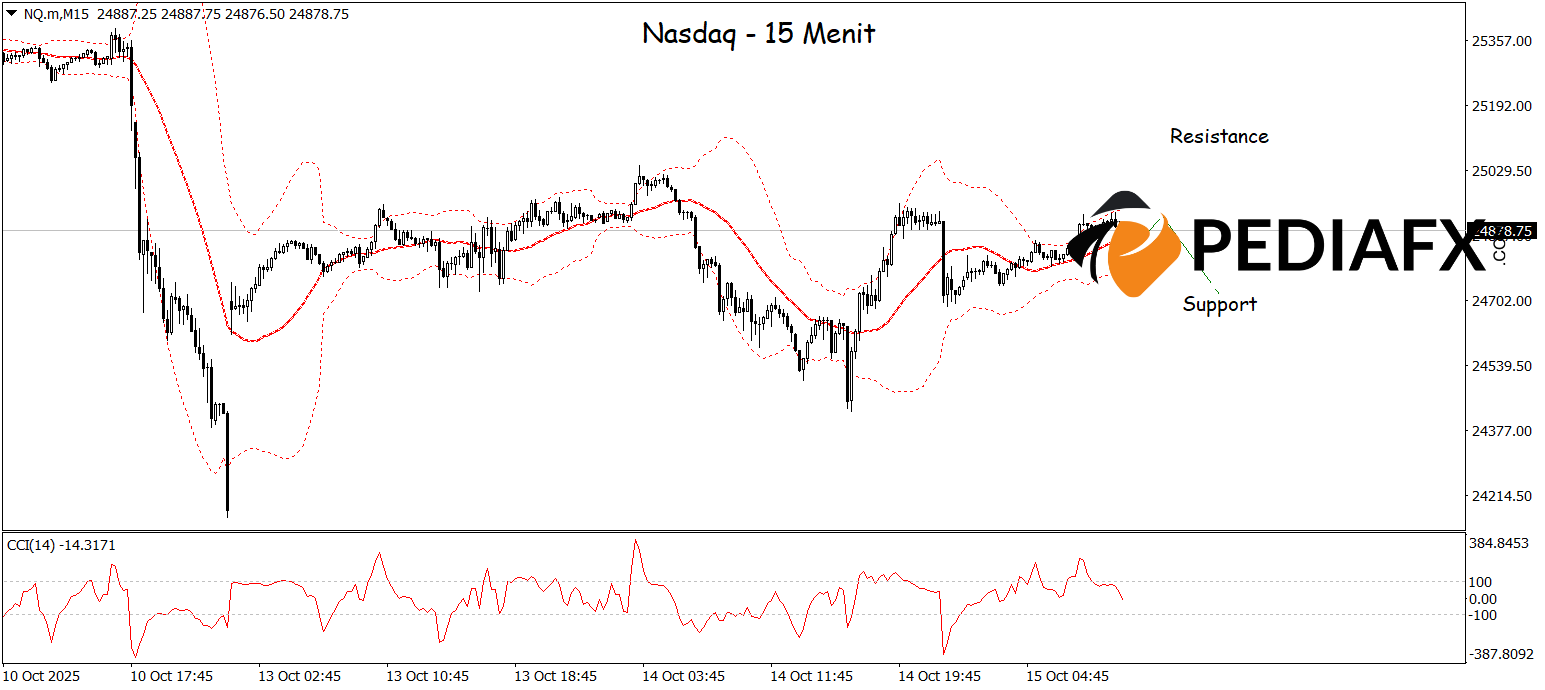
The Nasdaq index is showing potential weakness after failing to maintain its position at the Bollinger Bands (BB) resistance level and beginning a downward movement. Selling pressure is intensifying as evidenced by the CCI indicator dropping from the overbought territory, signaling a weakening upward momentum and an increase in seller dominance. Given these technical conditions, the Nasdaq has a chance to continue declining and test the important support level around 24,725 shortly.
Technical Reference: Sell while under 25,080
Potential Take Profit 1: 25,006
Potential Take Profit 2: 25,080
Potential Stop Loss 1: 24,785
Potential Stop Loss 2: 24,725


