

The price of gold is currently experiencing strong selling pressure as of tonight, revealing a technical structure that underscores the dominance of sellers. In the 1-hour chart, a Lower High and Lower Low pattern has emerged, typical of an active bearish trend. Consistent selling is pushing the price away from the resistance area, while every rebound attempt appears limited and merely corrective. This situation indicates that market sentiment towards this precious metal remains negative, with buying interest steadily weakening alongside the strength of the US dollar.
From a technical perspective, the Zigzag indicator has formed a sequence of declines in line with the sharply falling Moving Average (MA). Both indicators confirm that bearish pressure is still dominant without showing significant signs of weakening. As long as the price cannot break through and sustain above the nearest resistance level, the intraday bias for gold is expected to remain downward. Continuous selling pressure opens up opportunities for prices to test the next support area in the upcoming sessions.
Recommended

Recommended

Recommended

Recommended
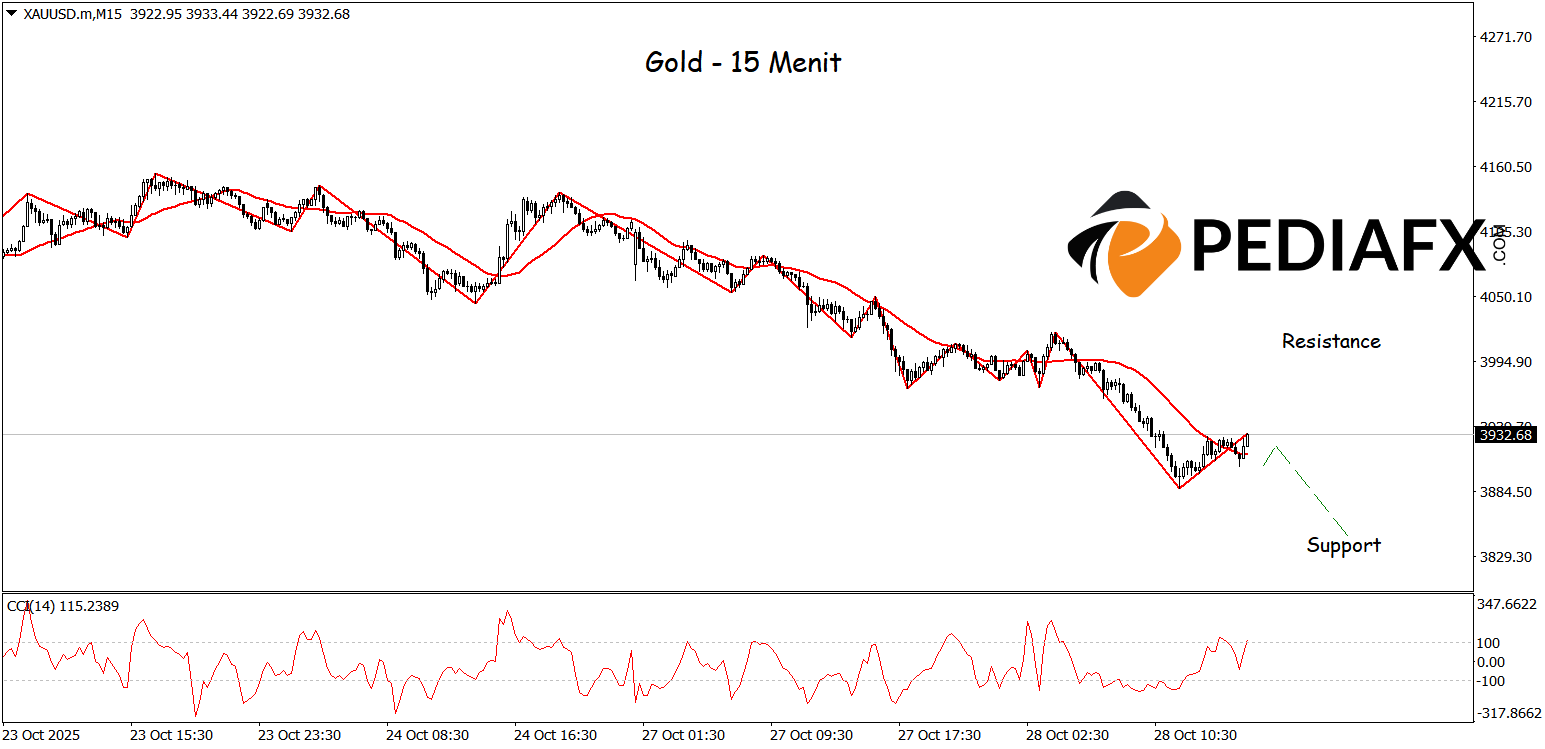
Gold’s movement on the 15-minute timeframe is beginning to show signs of weakening, as both the Zigzag and MA line are declining, indicating that selling pressure is becoming increasingly evident. On the other hand, the CCI, which is in the overbought area, reinforces the potential for a technical correction in the near term, as the previous upward momentum subsides. As long as the price remains under this pressure, the support level of 3,846 becomes a crucial area that may be tested to assess the strength of further declines, with the current intraday bias leaning bearish.
Technical Reference: sell while below 4,000
Potential Stop Loss 1: 3,975
Potential Stop Loss 2: 4,000
Potential Take Profit 1: 3,870
Potential Take Profit 2: 3,846


