


The GBPUSD currency pair is showing signs of potential weakness as technical indicators present clear bearish signals. The 24-period Moving Average (MA) indicates that prices are trading below the trend line, suggesting strong selling pressure.
In addition, the MACD indicator is further emphasizing the downward trajectory, with its histogram moving into negative territory and the signal line forming a bearish cross. This combination of indicators provides strong confirmation that bearish momentum is developing, creating opportunities for traders to enter short positions.

Recommended

Recommended

Recommended

Recommended
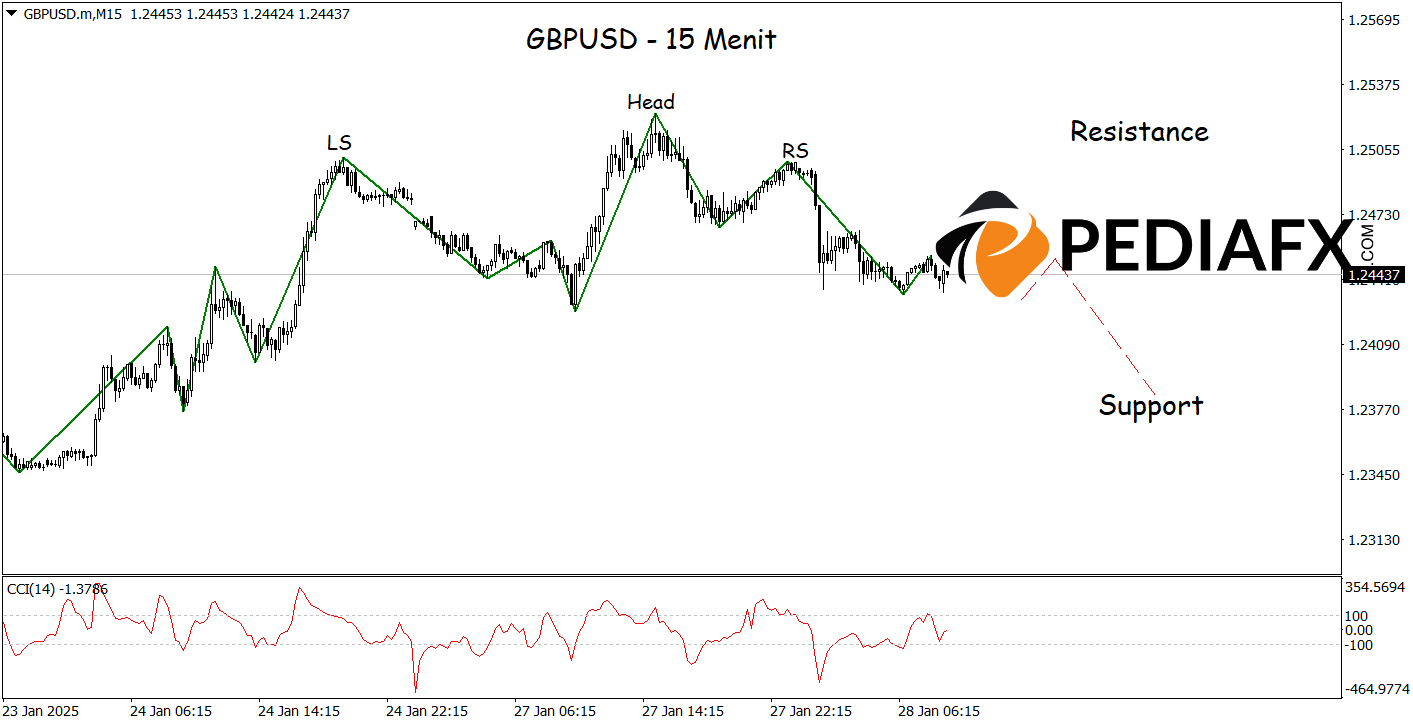
On the 15-minute timeframe, the Zigzag indicator for GBPUSD displays a Head and Shoulders pattern, signaling a potential reversal towards a downtrend, especially after the neckline has been successfully broken. This pattern is reinforced by the Commodity Channel Index (CCI), which indicates bearish signals as it moves below the -100 level, signaling increasing selling pressure. If the scenario plays out, GBPUSD could potentially decline towards the support level of 1.23865.
Technical Reference: sell while below 1.25050
Potential Stop Loss 1: 1.24845
Potential Stop Loss 2: 1.25050
Potential Take Profit 1: 1.24065
Potential Take Profit 2: 1.23865








