

The Nasdaq is beginning to lose its momentum after breaching the lower boundary of a bullish channel and recording a new low on the hourly chart. Following this decline, the price attempted a pullback to the previous breakout area, forming an Support Becomes Resistance (SBR) pattern — a classic signal suggesting the likelihood of a continuing downward trend.
The inability of buyers to maintain prices above this area indicates that sellers are starting to gain control of market movements. From a technical perspective, the ZigZag indicator and Moving Average (MA) display a consistent downward trend, with the price structure remaining below the MA.
Recommended

Recommended

Recommended

Recommended
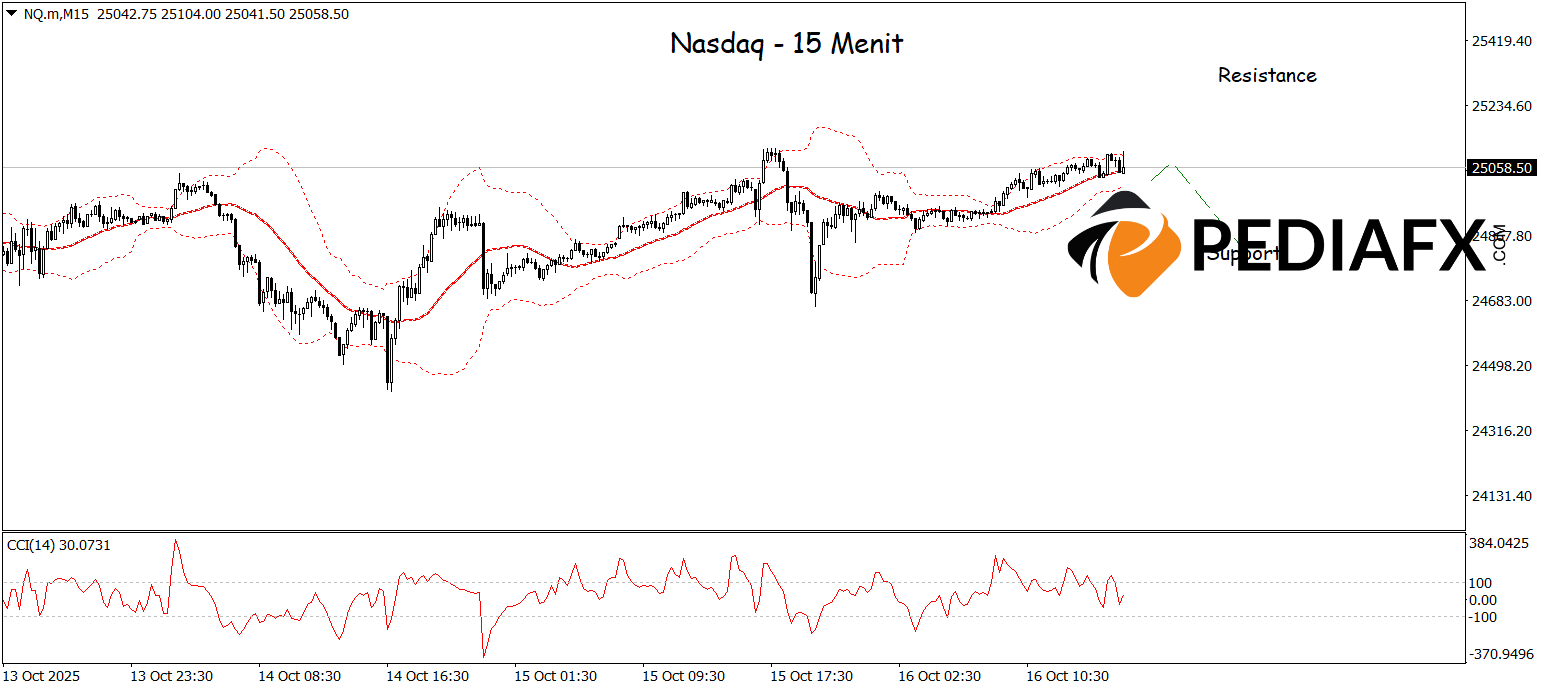
Meanwhile, the Bollinger Bands (BB) indicate pressure from the upper side, while the CCI has exited the overbought area, affirming the weakening of upward momentum. As long as the Nasdaq stays below the SBR area without strong reversal signals, the chances for a continuing bearish trend remain open, with a potential drop towards the support level around 24,835 in the near future.
Technical References: Sell while below 25,281
Potential Take Profit 1: 25,205
Potential Take Profit 2: 25,280
Potential Stop Loss 1: 24,920
Potential Stop Loss 2: 24,830


