

The GBPUSD currency pair, analyzed on a 1-hour timeframe, is demonstrating a robust upward trend, characterized by a consistent sequence of higher highs and higher lows. The recent breakout from a significant resistance zone indicates that buyers are regaining control, ushering the price into a more stable bullish phase. This strengthening technical structure reflects a positive market sentiment, creating room for a sustained rally as buying pressure remains dominant.
As the price now settles in the lower region of the bullish channel, it presents attractive opportunities for the upward trend to continue. The zigzag formation creating a new low underscores the potential for a rebound from the correction, while the CCI indicator exiting the oversold territory signals the readiness for a renewed bullish momentum. This combination of signals bolsters the outlook for GBPUSD to extend its rise, especially if buyers can maintain the HH–HL pattern intact and uphold the established upward momentum.
Recommended

Recommended

Recommended

Recommended
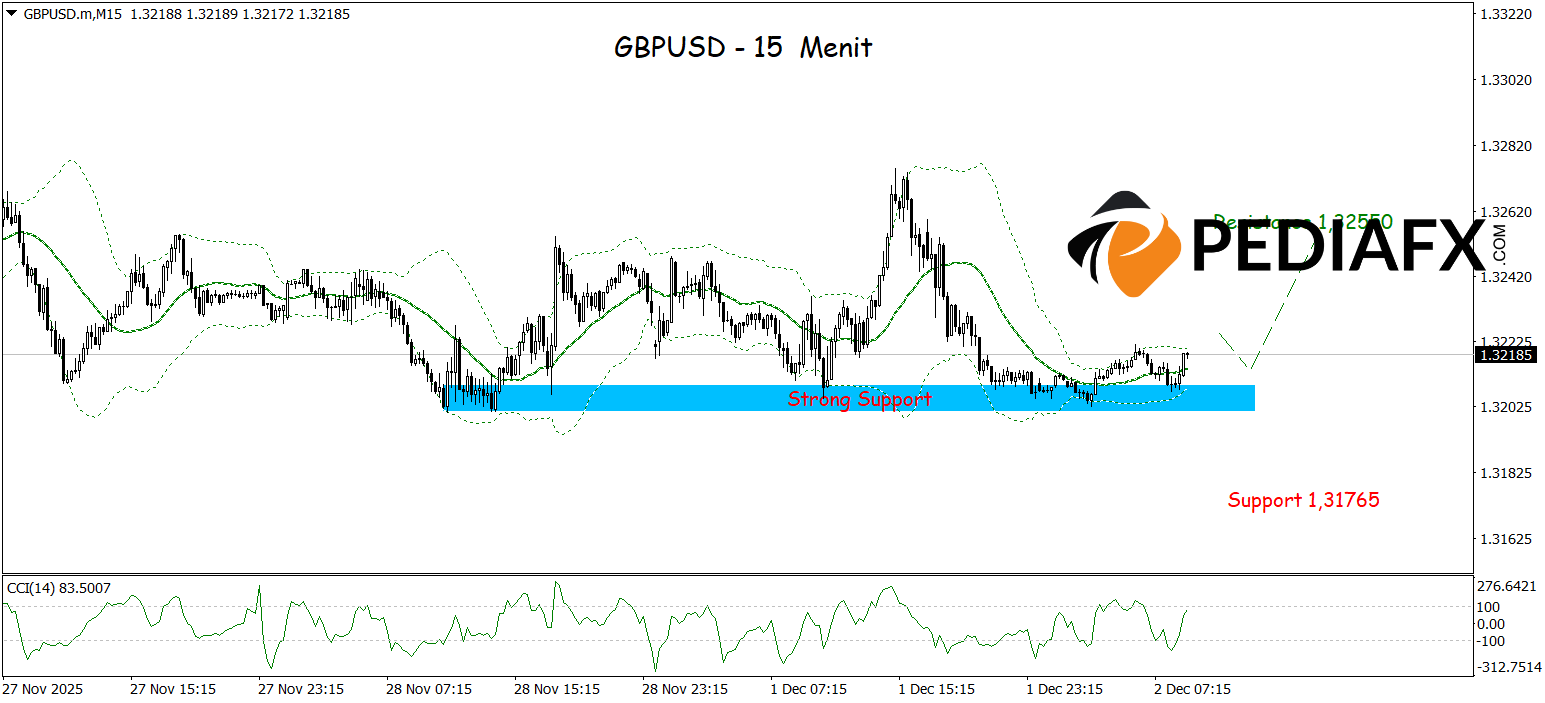
On the 15-minute chart, GBPUSD shows strong resistance to downward movement, with the price repeatedly testing the support area (marked in blue) yet bouncing back each time, indicating that buyers are defending this level. Concurrently, the CCI indicator reflects an oversold condition, implying that the potential for a rebound is strengthening. Should buying pressure persist from this zone, GBPUSD has the potential to continue its ascent and test the resistance level at 1.32550.
Technical Reference: buy while above 1.31765
Potential Take Profit 1: 1.32420
Potential Take Profit 2: 1.32550
Potential Stop Loss 1: 1.31880
Potential Stop Loss 2: 1.31765


