


The price is displaying signs of a rebound after reaching an oversold area according to the CCI and Bollinger Bands on the 1-hour time frame. The CCI, which was previously in the oversold zone, is now starting to rise, indicating a potential shift in momentum from bearish to bullish. Meanwhile, the price has also bounced off the lower Bollinger Band, often regarded as a dynamic support level. This bounce provides an early signal that selling pressure is beginning to wane and that buyers are starting to take control.
Additional confirmation comes from the Zigzag indicator, which has begun forming a higher low from that oversold area. This suggests that prices may gradually build a bullish structure, reinforcing the reversal scenario. If this movement continues and the price manages to break through the nearest resistance, the likelihood of a broader uptrend becomes increasingly feasible.

Recommended

Recommended

Recommended

Recommended
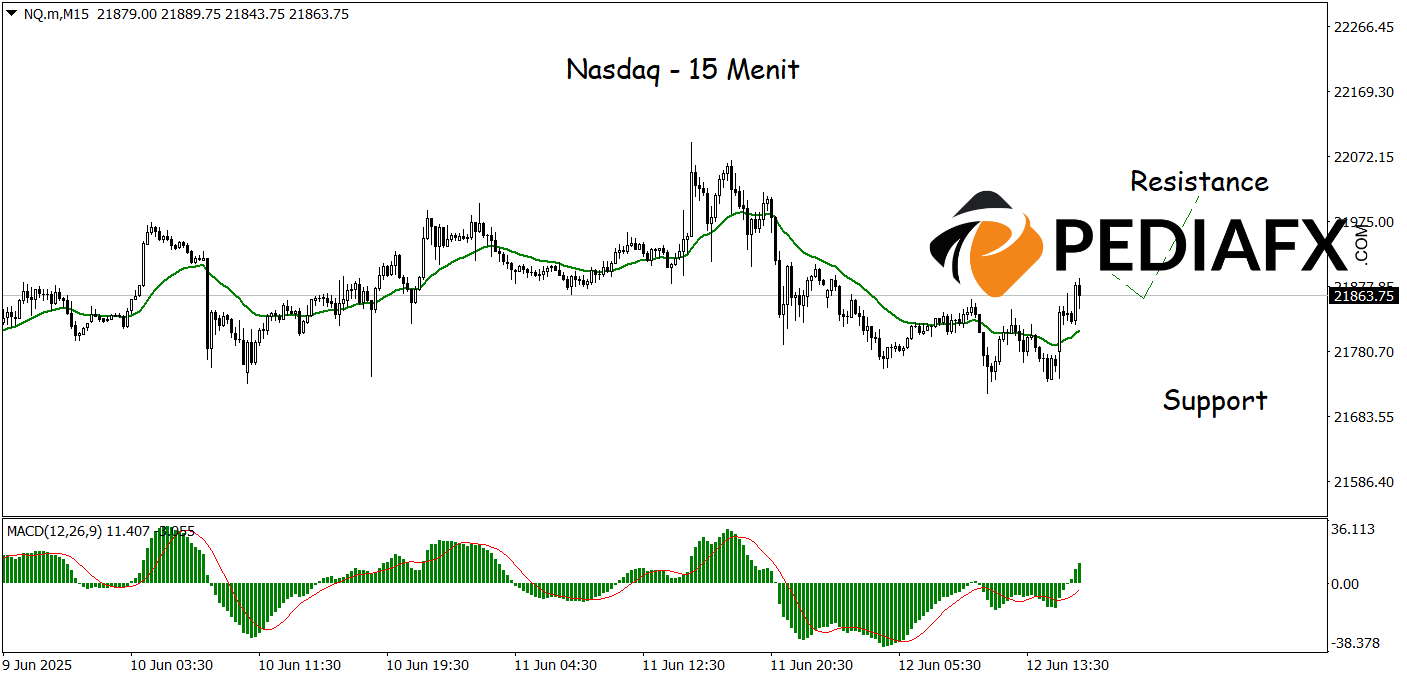
On the 15-minute time frame, the price movement shows a strong bullish tendency with solid technical support from the Moving Average (MA) and MACD indicators. The price is stabilizing above the MA line, which is starting to trend upward, reflecting the dominance of buyers in the short term. Additionally, the MACD indicator further confirms strengthening momentum with its histogram in positive territory and the signal line trending upward. The combination of these two indicators reinforces the outlook for a continuation of the uptrend in the near term, with a potential test at 22,013.
Technical Reference: buy above 21,730
Potential Take Profit 1: 21,968
Potential Take Profit 2: 22,013
Potential Stop Loss 1: 21,775
Potential Stop Loss 2: 21,730








