


The GBPUSD pair on the hourly chart is showing increasing selling pressure as the price breaks below the previously established bearish channel’s support line. This situation confirms that seller dominance remains robust, while bears seem to struggle in maintaining upward momentum. The ongoing price structure is setting lower highs and lower lows (LH-LL), which reinforces the downward trend, indicating that further declines are likely imminent.
From a technical standpoint, both the Zigzag and Moving Average (MA) indicators illustrate a downward trajectory, strengthening the short-term bearish bias. Additionally, the MACD indicator remains in negative territory, which further confirms the prevailing selling pressure. As long as prices stay below the minor resistance level, the likelihood of a decline towards the next support level remains significant, reflecting the current market sentiment that favors sellers.

Recommended

Recommended

Recommended

Recommended
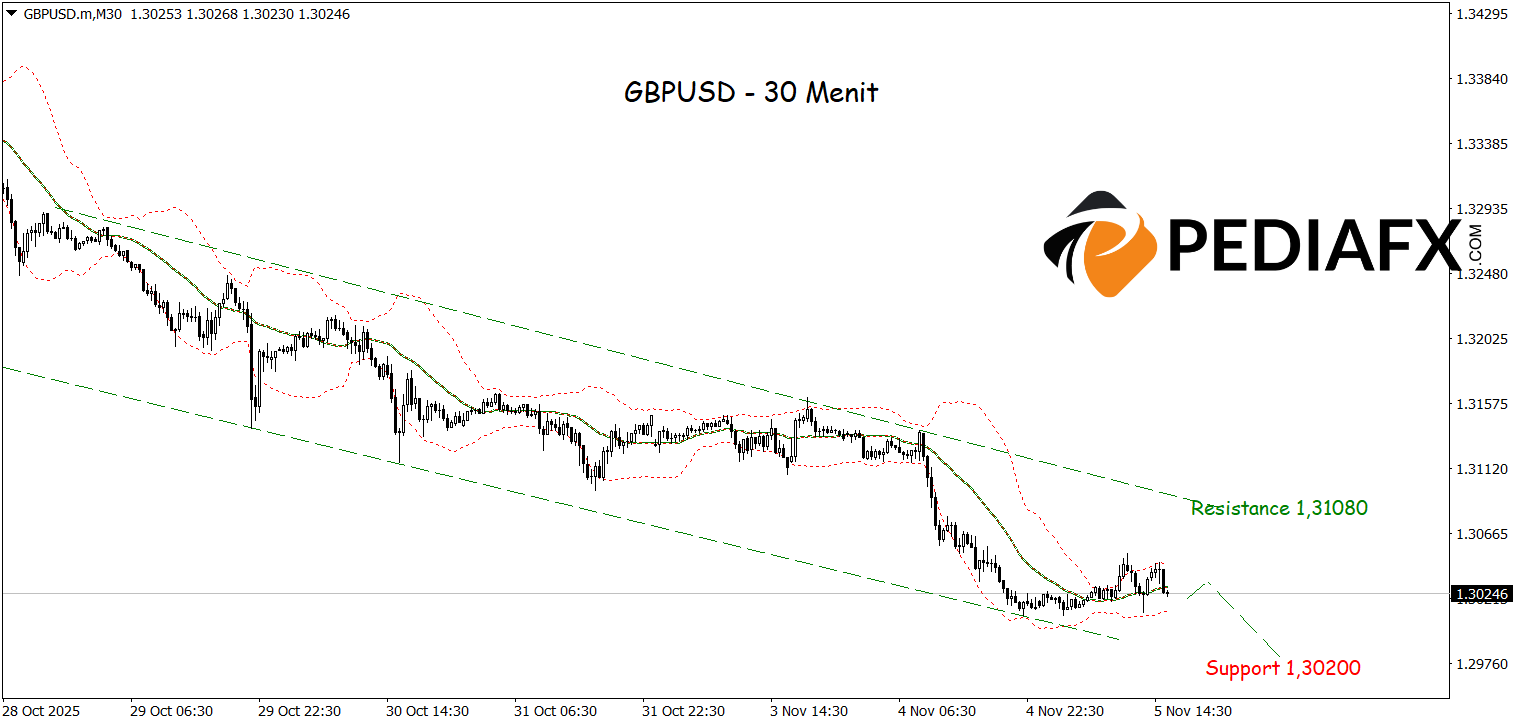
GBPUSD continues to be confined within a bearish channel, indicating that selling pressure is persistently dominating price movements. The decline in the direction of the Moving Average (MA) strengthens the notion that the downward trend remains intact, while the price’s breach below the lower Bollinger Bands (BB) suggests an increase in bearish momentum. This scenario highlights that sellers are still in control of the market and could potentially push the price down further. Unless there are strong signs of a reversal, GBPUSD may continue its downward trajectory to test the support level around 1.30200.
Technical References: sell when below 1.30765
Potential Stop Loss 1: 1.30535
Potential Stop Loss 2: 1.30765
Potential Take Profit 1: 1.29995
Potential Take Profit 2: 1.29800








