

The USDJPY currency pair is beginning to exhibit solid technical strengthening, backed by several critical indicators. Moving Average (MA) has started to trend upwards, suggesting that the price is in a recovery phase, paving the way for a potential continuation of the upward trend. Meanwhile, the Zigzag indicator has formed a higher low and higher high pattern, indicating a bullish market structure in the short to medium term. This combination provides early signals that buying pressure is starting to dominate price movements.
In addition, the MACD indicator reinforces this bullish scenario by displaying a positive crossover and a histogram that continues to expand above the zero line. This reflects a relatively stable bullish momentum, offering further support for the USDJPY to sustain its upward rally.
Recommended

Recommended

Recommended

Recommended
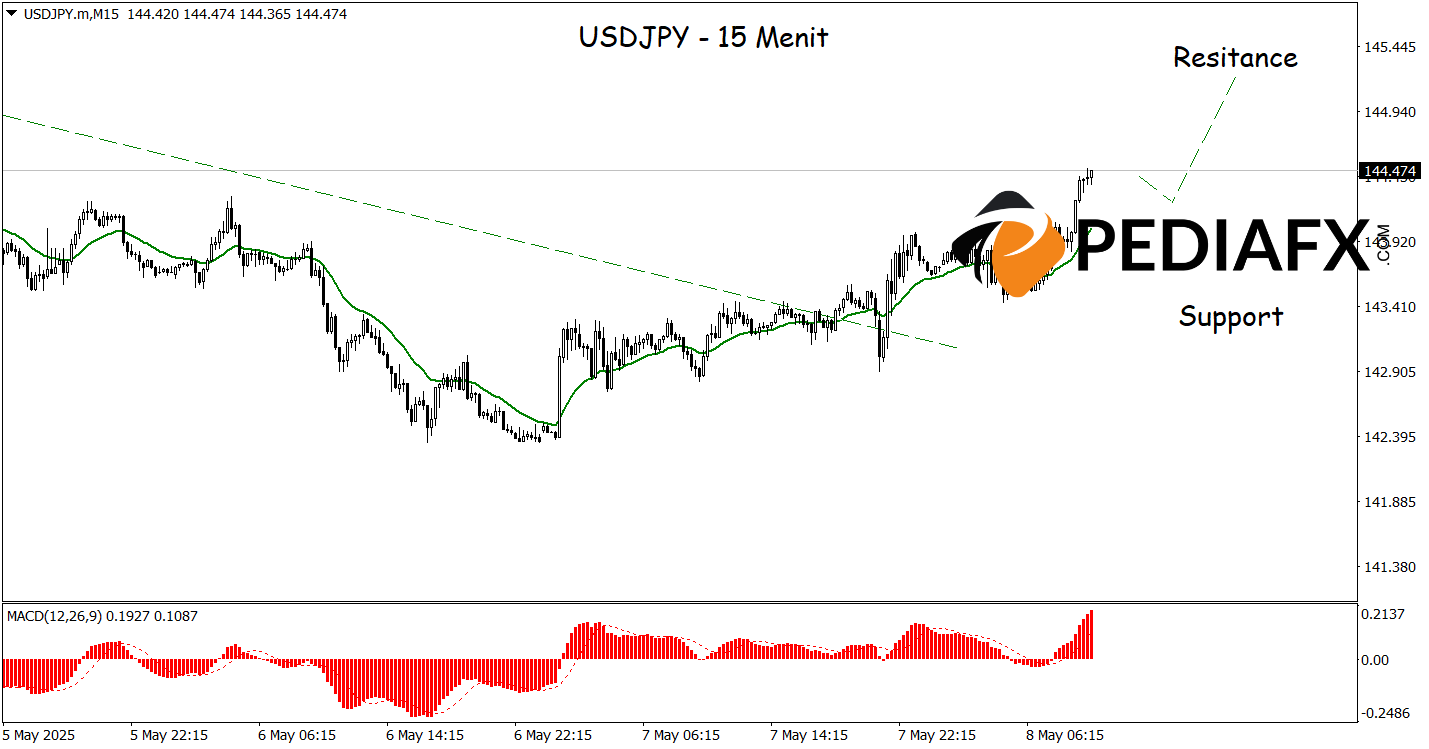
On the 15-minute chart, the USDJPY displays strong potential for strengthening after breaking through the bearish trendline, indicating the end of short-term downward pressure. The rising momentum is further bolstered by the price trading above the Moving Average (MA), which is also beginning to incline upwards. This situation reflects a shift in market sentiment towards bullishness, creating opportunities for the USDJPY to enhance its ascendance towards the resistance level of 145.210.
Positive Indicators from Trendline & Zigzag: Is USDJPY Heading for Continued Gains?
The USDJPY signals positive trends with the establishment of a bullish trendline on the price chart, indicating the potential for continued upward movement following a short-term consolidation. The price has recorded higher lows, further solidifying this bullish pattern. Moreover, the Zigzag indicator is beginning to show upward movement, confirming that the bullish momentum may persist. This pattern points towards the potential for higher targets in the upcoming sessions, especially if the price remains above the established support level.
As long as the price can maintain this support level and trade above the bullish trendline, the USDJPY has a chance to test the nearest resistance and continue its bullish trajectory.
On the 15-minute timeframe, the USDJPY demonstrates strong signals to continue its upward movement as the Moving Average (MA) starts to trend bullish, indicating a shift in momentum towards positivity. Additionally, the MACD indicator strengthens the potential for rises with the MACD line starting to trend upwards and nearing the bullish crossover zone. Both factors suggest that buying pressure is starting to dominate the market, and if the price continues to stay above the MA, the USDJPY may advance towards the resistance level of 145.045.
Technical Reference: buy above 143.415
Potential Take Profit 1: 144.875
Potential Take Profit 2: 145.210
Potential Stop Loss 1: 143.755
Potential Stop Loss 2: 143.415


