

The GBPUSD pair continues to operate within a bearish channel, indicating that selling pressure remains predominant in the short-term price structure. The price action on the 1-hour time frame reveals a consistent pattern of Lower Highs and Lower Lows, suggesting that sellers still maintain full control over the price direction. Each attempt for a price increase is met with renewed selling pressure that stymies these gains, ensuring that the bearish bias remains strong and valid as long as the price does not break out of this descending channel.
From a technical indicator perspective, signals of weakening have been increasingly confirmed. The Moving Average appears to flatten out in line with the bearish trend, while the CCI is in the overbought territory, typically triggering further downside potential. This blend of price action and indicators opens up possibilities for GBPUSD to test the support level on the 1-hour time frame, especially if selling pressure intensifies during the afternoon session.
Recommended

Recommended

Recommended

Recommended
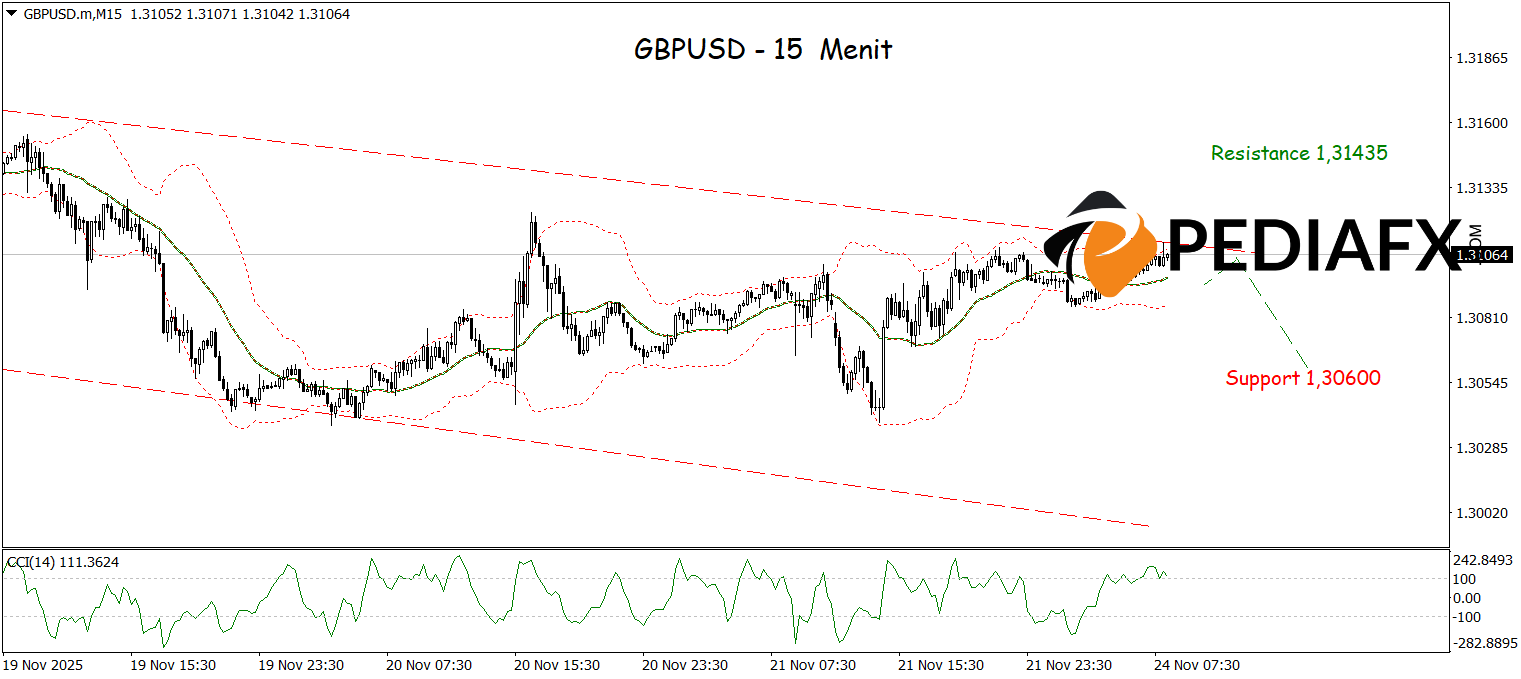
Moreover, a breakout from the low of the bearish channel further reinforces the signal that the downward pressure on GBPUSD in the 15-minute time frame may persist. The price is currently held at the resistance of the Bollinger Bands, indicating that the pullback likely has ended and sellers are regaining dominance, while the CCI in the overbought area reflects a weakening upward momentum. With this technical combination, GBPUSD has a chance to continue its decline and test a key support level at 1.30430.
Technical Reference: sell below 1.31435
Potential Stop Loss 1: 1.31275
Potential Stop Loss 2: 1.31435
Potential Take Profit 1: 1.30740
Potential Take Profit 2: 1.30600


