

The Nasdaq’s movement on the 1-hour timeframe indicates a shift in price structure as the previously supportive bullish channel has now been breached downwards. This decline has triggered the creation of a new low followed by a pullback to the break area, which now acts as dynamic resistance. This scenario illustrates that selling pressure is beginning to rise, while the zigzag pattern along with the downward turn of the Moving Average (MA) further strengthen the potential for a reversal toward a short-term bearish trend. It indicates that buyers are gradually losing control, allowing sellers to gain momentum in the market.
From the momentum indicator perspective, the CCI is now in the overbought zone following the pullback, adding technical confirmation for further potential correction. As long as prices fail to breach back above the break area and remain below that resistance level, the chances for additional declines remain wide open. With this combination of predominantly negative technical signals, the Nasdaq is poised to continue weakening toward nearby support levels if selling pressure persists in the coming hours.
Recommended

Recommended

Recommended

Recommended
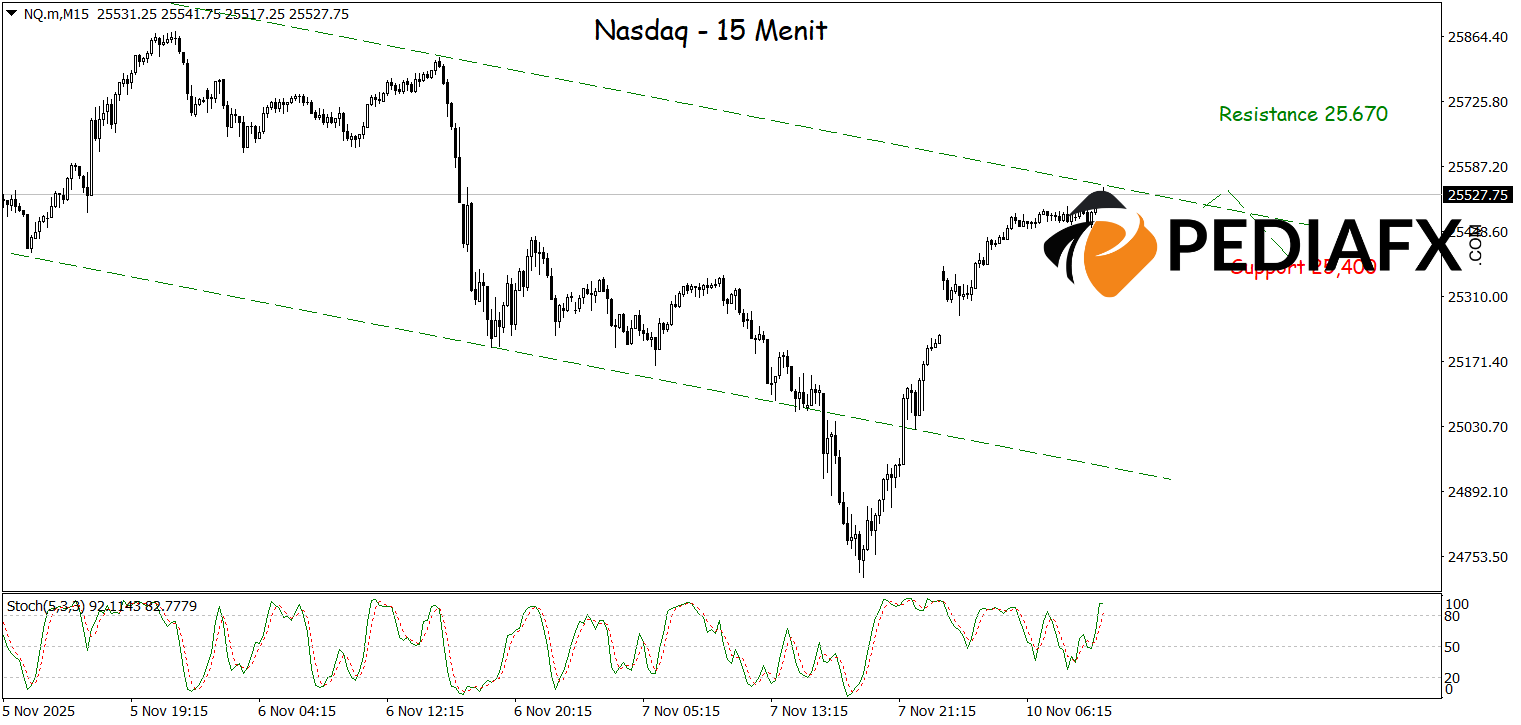
The newly formed bearish channel visible on the 15-minute timeframe shows that selling pressure is still dominating Nasdaq’s movement. This condition is further reinforced by the Stochastic indicator residing in the overbought region, indicating that the potential for upward movement is limited and the likelihood of corrective pressure emerging soon is high. With this technical signal combination, Nasdaq could weaken during the European session and test the nearest support area around the 25,400 level as its next downside target.
Technical Reference: sell below 25,670
Potential Take Profit 1: 25,608
Potential Take Profit 2: 25,670
Potential Stop Loss 1: 25,460
Potential Stop Loss 2: 25,400


