

The Nasdaq continues to display signs of weakness as it breaches the lower boundary of the bullish channel and establishes a lower low on the hourly chart. This movement indicates a shift in trend direction from bullish to bearish, with increasing selling pressure becoming apparent. Following this steep decline, the price briefly retraced to the previous breakout area, forming a Support Become Resistance (SBR) pattern — a classic technical signal indicating potential continuation of the downward trend in the near term.
The failure of the buyers to maintain prices above the SBR area shows that market control has now shifted to the sellers. From a technical standpoint, the ZigZag indicator and Moving Average (MA) are revealing a consistent downward trajectory, with price structures stabilizing below the MA. This scenario reinforces the view that the bearish momentum remains dominant, and any temporary rises are likely just phases of correction before the next decline.
Recommended

Recommended

Recommended

Recommended
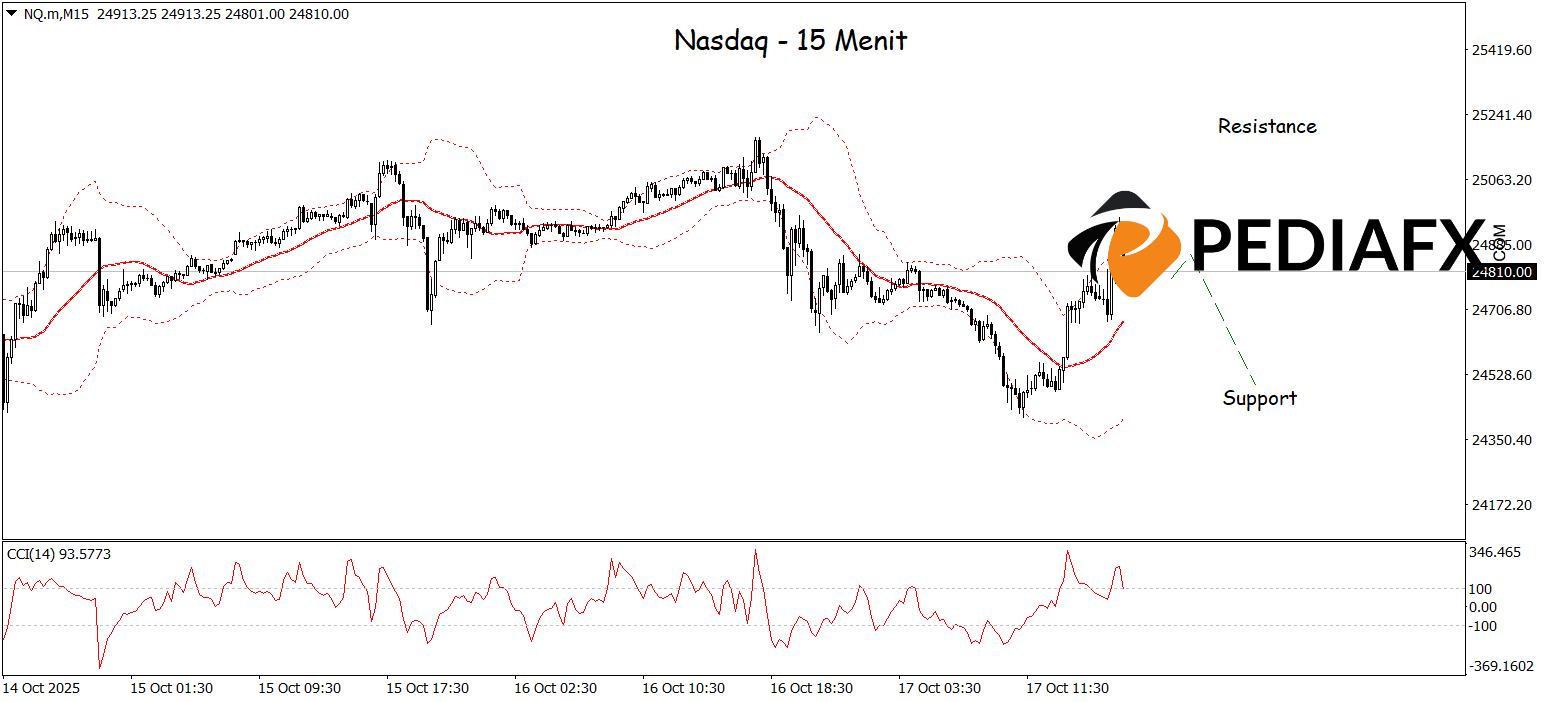
Additionally, the Bollinger Bands (BB) are exhibiting pressure from the upper side, while the CCI has moved out of the overbought territory, indicating a weakening upward thrust. As long as the Nasdaq remains below the SBR area without significant reversal signs, the chances for a continuation of the bearish trend remain highly open, with a potential decline target towards the support area around 24,485 in the near future.
Technical Reference: Sell while below 25,180
Potential Take Profit 1: 25,075
Potential Take Profit 2: 25,180
Potential Stop Loss 1: 24,580
Potential Stop Loss 2: 24,485


