

The Nasdaq is displaying significant signs of weakening as it breaks through the support area of the previously dominant bullish channel. This breach indicates that buying momentum is starting to wane, while selling pressure is on the rise. The price structure is shifting from a pattern of higher highs to lower highs, reinforcing the indication that the upward trend is losing strength. This scenario also reflects a shift in market sentiment from optimism to caution, with market participants likely adopting defensive positions ahead of the European session this afternoon.
From a technical perspective, the bearish signals are becoming clearer with the sharply declining direction of the Moving Average (MA) and the ZigZag indicator forming a new downward pattern. Furthermore, the weakening of buying momentum is evident from the decrease in transaction volume at the upper levels, which strengthens the potential for further corrections. If the selling pressure persists, the Nasdaq may test the next support level soon. However, should there be a rebound from the support area, the price movement is likely to be temporary before the downtrend reasserts itself.
Recommended

Recommended

Recommended

Recommended
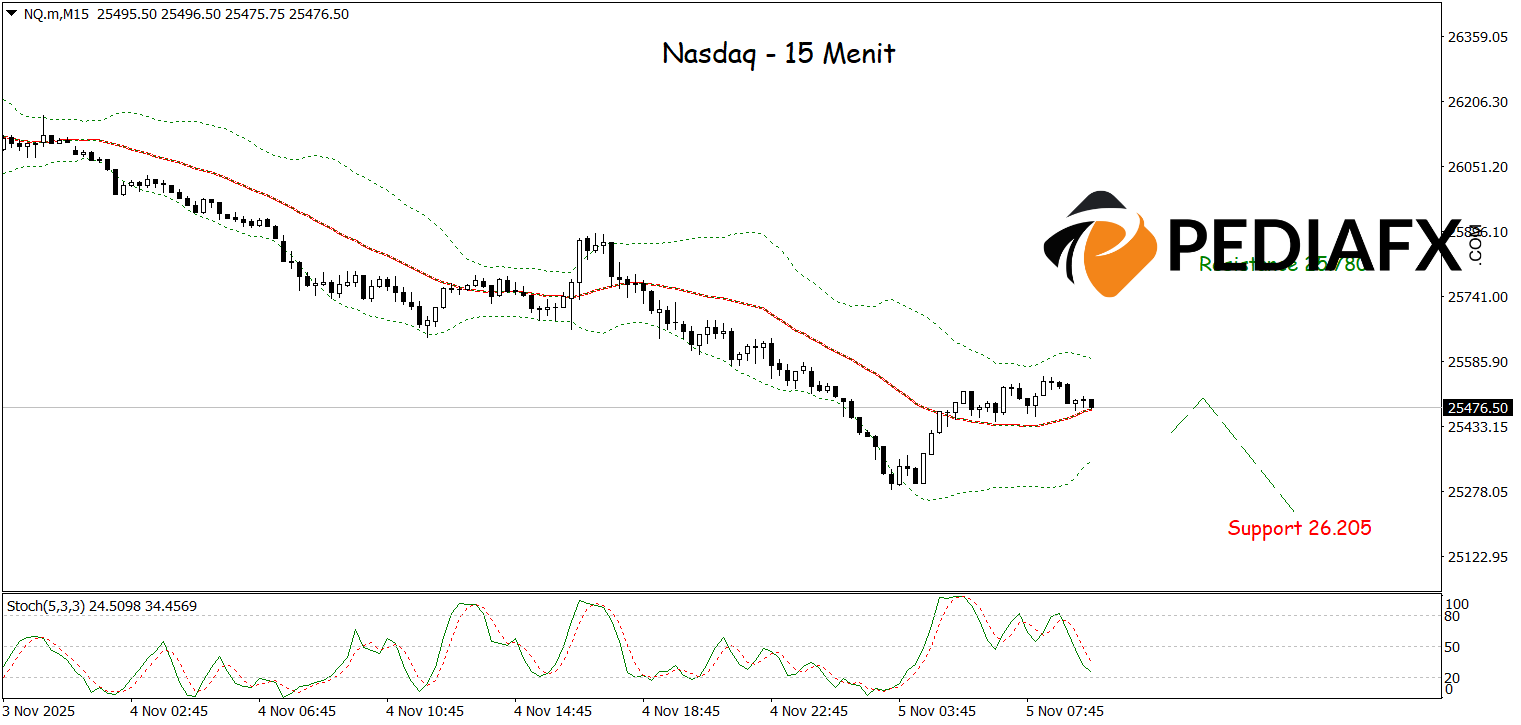
The bearish pressure has become increasingly apparent after the price dropped below the lower boundary of the Bollinger Bands (BB), indicating that selling pressure is intensifying. The continuously declining MA along with the formation of a bearish trendline serves as additional confirmation that the downward momentum is still in play. As long as the price remains below the minor resistance area and selling pressure persists, the Nasdaq could continue to weaken, testing the next support area around 25,207 in the near term.
Technical Reference: sell while below 25,780
Potential Take Profit 1: 25,290
Potential Take Profit 2: 25,207
Potential Stop Loss 1: 25,696
Potential Stop Loss 2: 25,780


