

The Nasdaq exhibits the potential for a continued downward trend after breaching the lower boundary of a bullish channel on the 1-hour time frame. This breaklow serves as an indication of a shift in market structure from an upward trend to a bearish inclination. Currently, the price appears to be retreating back to the classic pattern break area, often exploited by sellers to re-enter the market and push prices lower. This scenario frequently marks the onset of the next downward wave in the ongoing bearish trend.
The sell pressure on the Nasdaq during the US session has intensified, supported by the CCI indicator residing in the overbought zone. This scenario reflects that prices have risen excessively in the short term and have a high likelihood of correcting. With the combination of a pullback pattern and aligned momentum indicators, the potential for a decrease in the Nasdaq toward further support levels is quite significant. Traders are advised to monitor price reactions at the break area as a valid reference for entry sell opportunities.
Recommended

Recommended

Recommended

Recommended
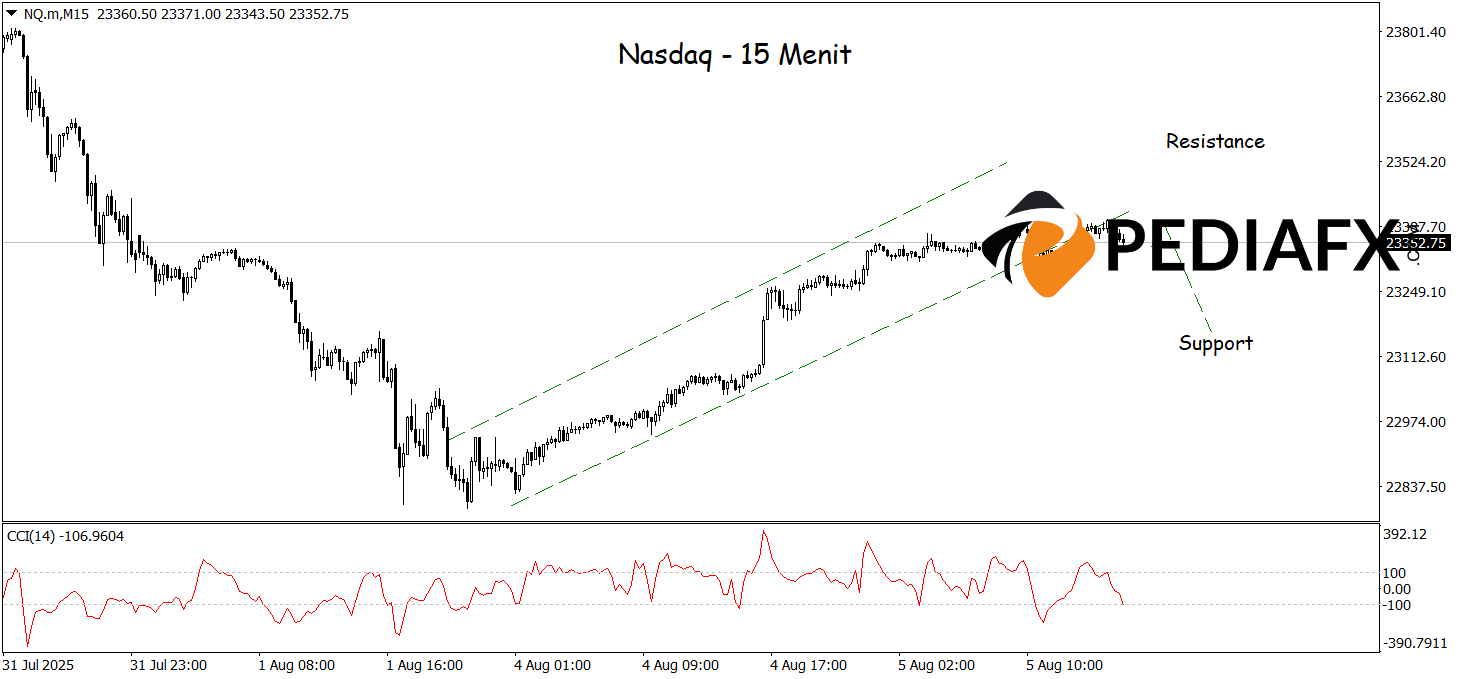
Additionally, the Nasdaq indicates the prospect of further declines on the 15-minute chart after the price has crossed below the lower limit of the bullish channel, signaling the end of the short-term upward momentum. The sell pressure becomes more apparent as the CCI sharply drops from the overbought area, indicating a weakening of buying power and opening avenues for deeper corrections. With these technical confirmations in place, the Nasdaq is likely poised to continue its descent towards support level at 23,161 in the near term.
Technical Reference: sell while below 23,542
Potential Stop Loss 1: 23,467
Potential Stop Loss 2: 23,542
Potential Take Profit 1: 23,227
Potential Take Profit 2: 23,161


