

The Nasdaq is displaying signs of weakness after it failed to establish a new high near the resistance zone indicated by the shaded blue area. The price movement stalling at this level suggests that selling pressure is starting to increase, especially since this resistance area has been tested multiple times without a breakthrough. This pattern indicates that the upward momentum is beginning to fade, thus raising the chances of a price correction in the near term.
From a technical perspective, the ZigZag indicator highlights a consistent peak coinciding with the resistance zone, further reinforcing the idea that the market is facing significant obstacles at this level. In addition, the CCI is currently situated in the overbought territory, adding to the downward pressure on the Nasdaq and increasing the likelihood of a decline soon. If selling pressure continues, the index may correct towards the nearest support level before determining its next direction.
Recommended

Recommended

Recommended

Recommended
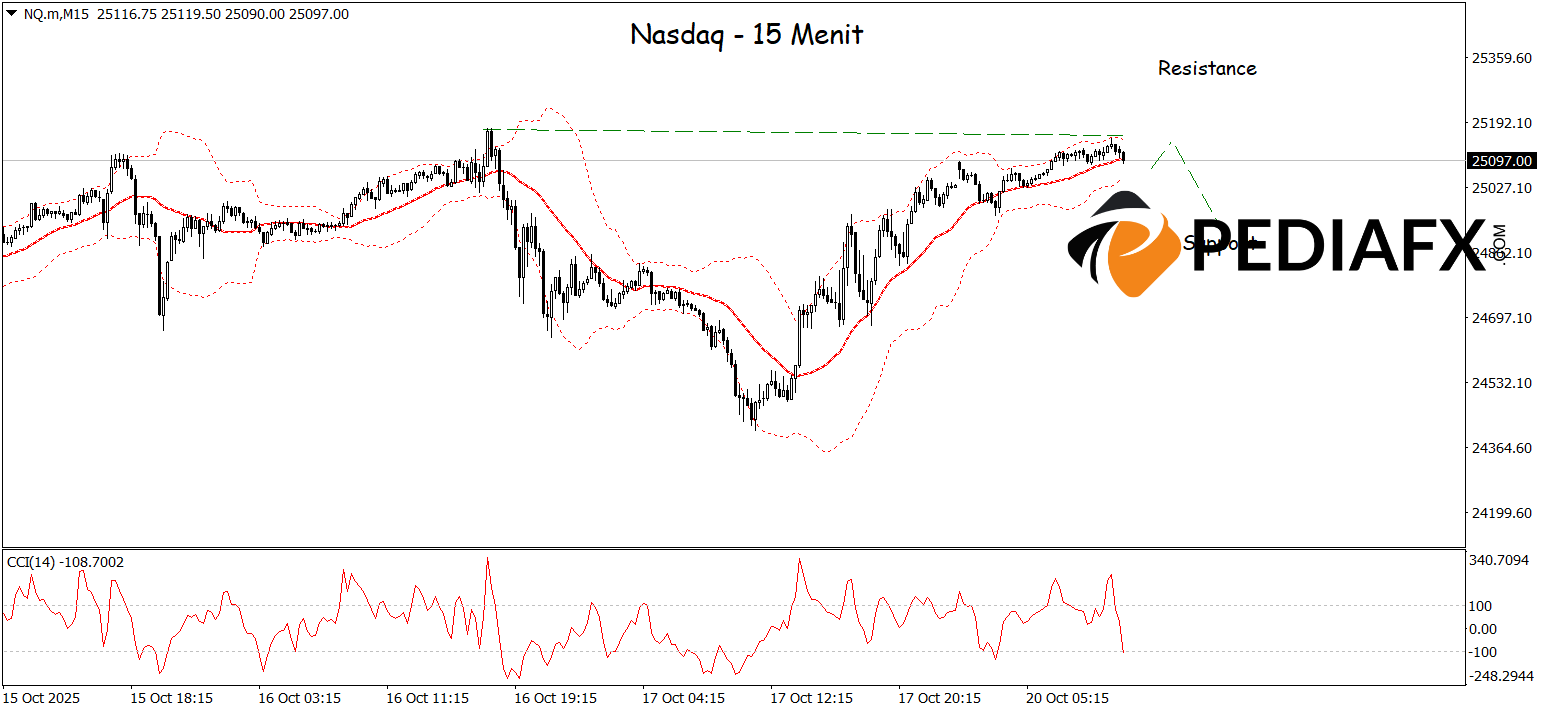
On the 15-minute timeframe, the Nasdaq reveals a selling opportunity after forming a double top pattern that signals a potential reversal from the prior upward trend. The price rejection at the Bollinger Bands’ resistance area reinforces the weakening buying pressure, while the CCI in the overbought region adds confirmation to the expected correction. With this combination of technical signals, the Nasdaq is likely to continue its bearish movement towards the lower level around 24,897.
Technical Reference: Sell while below 25,306
Potential Take Profit 1: 25,245
Potential Take Profit 2: 25,306
Potential Stop Loss 1: 24,963
Potential Stop Loss 2: 24,897


