

The bullish signals on the Nasdaq index are still indicating strength, as a consistent upward pattern continues to form on the 1-hour timeframe. The ZigZag indicator reveals a series of higher lows, suggesting that selling pressure is diminishing, and buyers are starting to gain control over the market direction. The upward slope of the Moving Average (MA) further solidifies the trend structure, demonstrating price stability above previously established averages, which is a hallmark of a market in a bullish phase.
This dominance by buyers is reinforced by a sell exhaustion signal from the Commodity Channel Index (CCI), which typically indicates that prices are poised for an upward rebound following limited corrections. This scenario creates a technical opportunity for the Nasdaq to resume its rally toward the upcoming resistance levels. As long as there is no sharp decline below the higher low structure, the upward trend is expected to persist, and market participants should look for entry points during brief pullbacks confirmed by volume and price action.
Recommended

Recommended

Recommended

Recommended
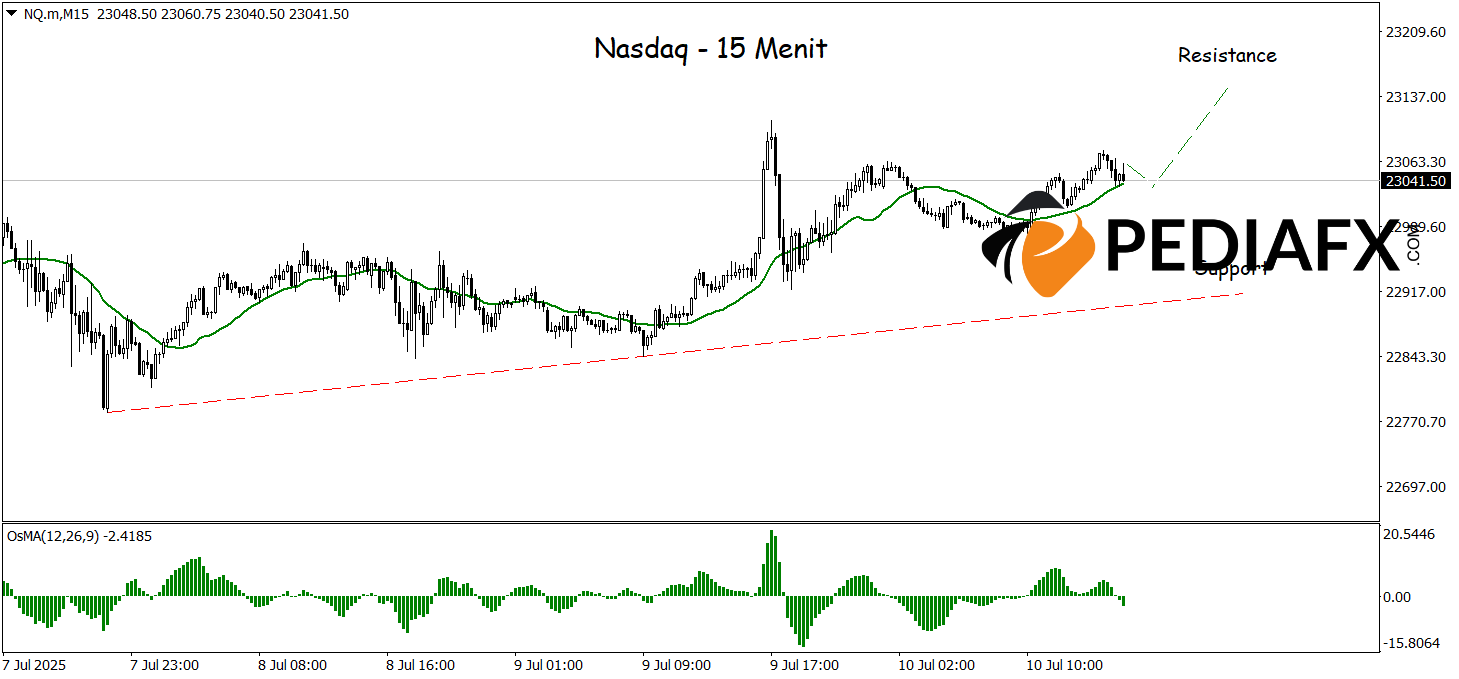
The Nasdaq continues to uphold a strong upward trend on the 15-minute timeframe, evidenced by the formation of a rising trendline that maintains price movements on a positive track. The ascending direction of the Moving Average (MA) also supports the bullish technical setup, signaling that buyers’ strength remains dominant in the market. Additional support is provided by the OSMA indicator, which is situated in positive territory, reflecting that bullish momentum is robustly preserved. With this combination of technical factors, the Nasdaq has ample opportunity to strengthen toward the resistance area around 23,140.
Technical Reference: buy as long as above 22,948
Potential Take Profit 1: 23,113
Potential Take Profit 2: 23,142
Potential Stop Loss 1: 22,982
Potential Stop Loss 2: 22,938


