

On the hourly chart, the Nasdaq has displayed a renewed bullish signal as the price successfully moves above the Moving Average (MA) line. This consistent position above the moving average indicates that an upward trend is gaining strength, with buyers regaining control. The recent rise reflects positive market sentiment, as investors grow more optimistic about the technology index’s future prospects.
Additionally, the MACD indicator enhances the bullish outlook with its histogram starting to enter positive territory. This technical confirmation adds further support for Nasdaq to continue its rally toward the next resistance level. As long as the price remains above the nearest support, the possibility of continued upward movement remains wide open, indicating a positive short-term trend for Nasdaq.
Recommended

Recommended

Recommended

Recommended
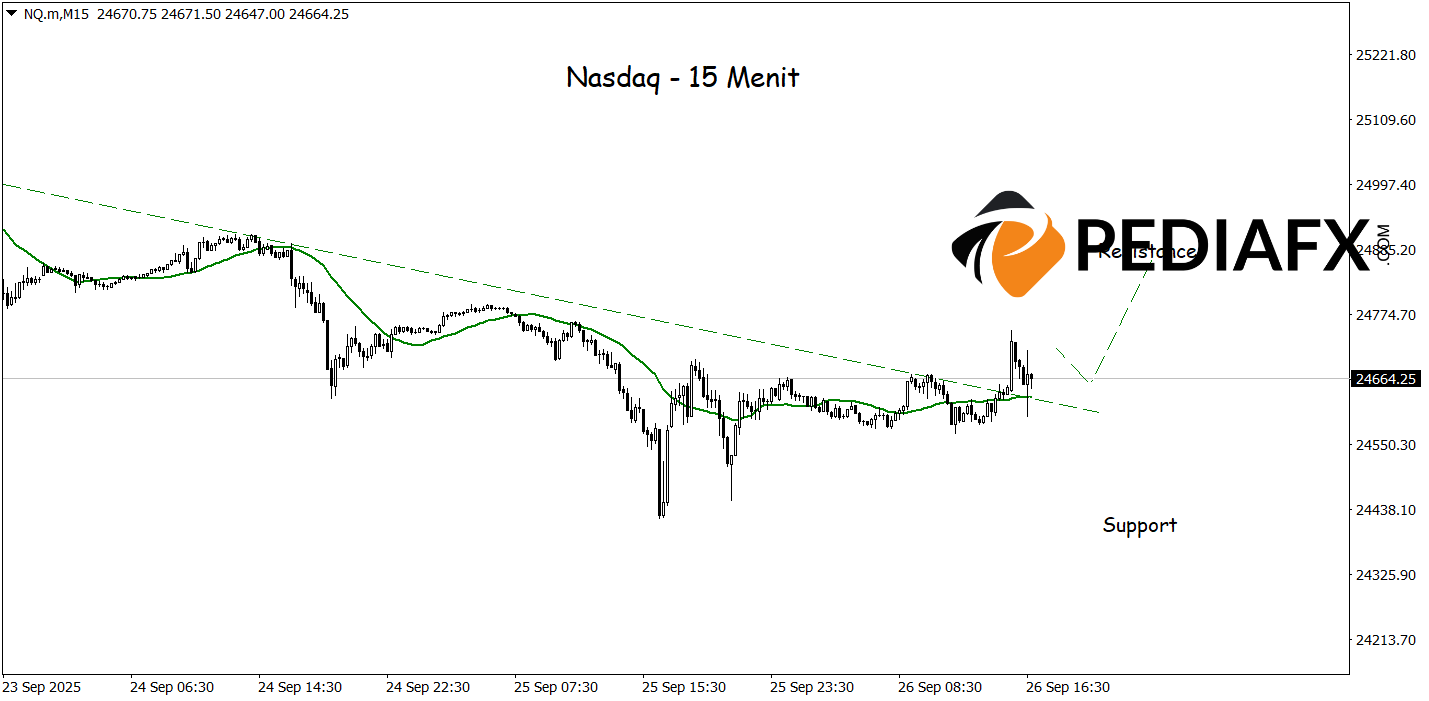
On the 15-minute chart, Nasdaq has successfully broken above a bearish trendline, while the Moving Average (MA) starts to incline upward, signaling that bullish momentum is forming. This technical condition provides an opportunity for Nasdaq to further strengthen and test significant resistance levels around 24,875, as long as the price remains above the nearby support.
Technical Reference: buy as long as above 24,422
Potential Take Profit 1: 24,804
Potential Take Profit 2: 24,875
Potential Stop Loss 1: 24,494
Potential Stop Loss 2: 24,422


