


The Nasdaq is currently showing increasingly clear signs of weakness as prices have breached the lower boundary of the Bollinger Bands. This decline suggests a prevailing selling pressure, breaking through the support level that previously held the price movements in check. Such patterns often serve as early indicators of potential further declines, especially when the market fails to stay within the normal Bollinger channel.
This bearish pressure is further corroborated by the MACD indicator, which is currently displaying the MACD line crossing beneath the signal line and distancing itself from the zero line. This condition indicates a strong negative momentum, supporting the continuation of a downtrend.

Recommended

Recommended

Recommended

Recommended
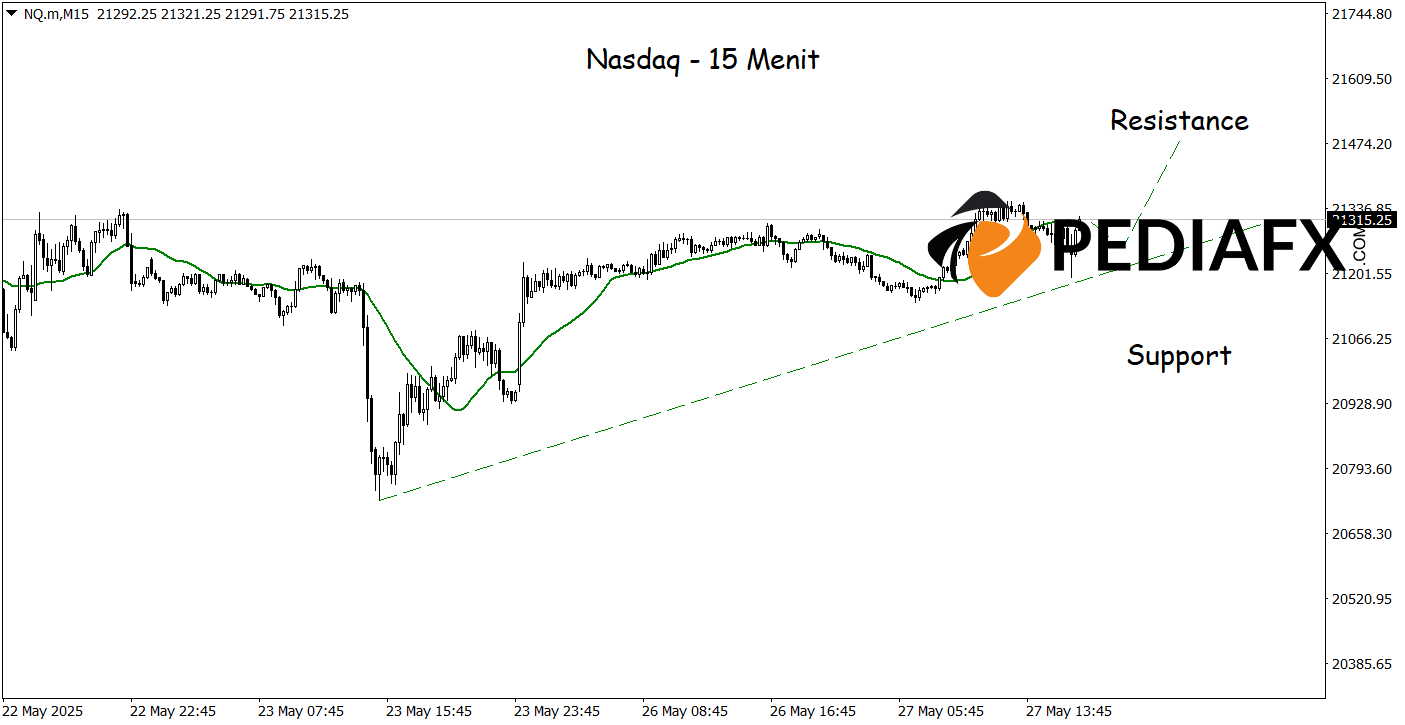
On a 15-minute time frame, the Nasdaq is following a bearish channel pattern indicating that selling pressure continues to dominate short-term price movements. The Moving Average (MA) line also shows a sharp downward slope, confirming that bearish momentum is strengthening. As long as prices remain below the MA and fail to break through the upper boundary of the channel, the potential for further declines looms large, targeting 20,545.
Technical Reference: Buy when above 21,050
Potential Take Profit 1: 21,430
Potential Take Profit 2: 21,500
Potential Stop Loss 1: 21,135
Potential Stop Loss 2: 21,050








