

A double bottom pattern has developed on the 1-hour chart of the Nasdaq, signaling a strong technical indication of a potential upward reversal. The price has experienced a sharp rebound from this area, suggesting that buyers are starting to regain control over the market movement. This situation lays a foundation for the Nasdaq to continue its upward momentum in the short term.
Additional support is provided by the ZigZag indicator and Moving Average (MA), both of which confirm a bullish trend, while the MACD begins to rise into positive territory. This combination of signals reinforces the notion that the upward momentum is becoming increasingly robust, presenting opportunities for the Nasdaq to sustain its upward trend and potentially test the next resistance level.
Recommended

Recommended

Recommended

Recommended
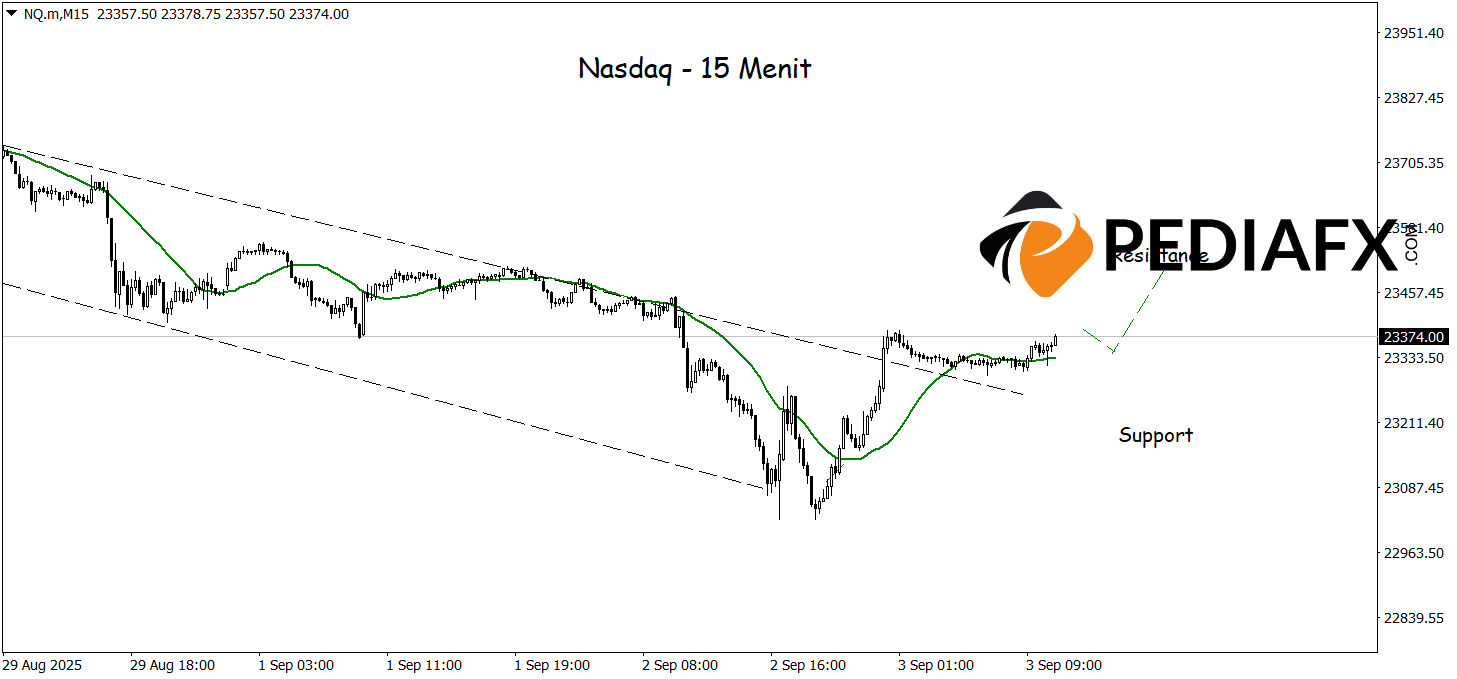
The Nasdaq successfully broke through the bearish channel high on the 15-minute chart, while the MA indicates an upward trend. This technical signal opens the door for further strengthening, with the potential for the Nasdaq to rise and test the resistance level at 23,500.
Technical Reference: buy above 23,207
Potential Take Profit 1: 23,430
Potential Take Profit 2: 23,500
Potential Stop Loss 1: 23,265
Potential Stop Loss 2: 23,207


