

The Nasdaq has witnessed a notable decline as it moves away from the pullback region highlighted in blue on the hourly chart. This latest price drop reinforces the established downward trend, characterized by a continuous zigzag pattern forming successive lower highs and lower lows. The Moving Average (MA) beginning to tilt downwards further confirms that the bearish trend is currently prevailing in the market. This situation suggests that each rebound attempt is likely being seized by traders to re-enter selling positions.
Additional support for the potential continuation of this downward movement comes from the Commodity Channel Index (CCI), which is situated in the overbought zone. This overbought signal indicates that the previous upward momentum is waning, paving the way for selling pressure to take control. As long as the price remains below the pullback area and the MA sustains its downward slope, there is a potential for the Nasdaq to continue its decline, testing the next support level amidst a growing bearish bias in the market.
Recommended

Recommended

Recommended

Recommended
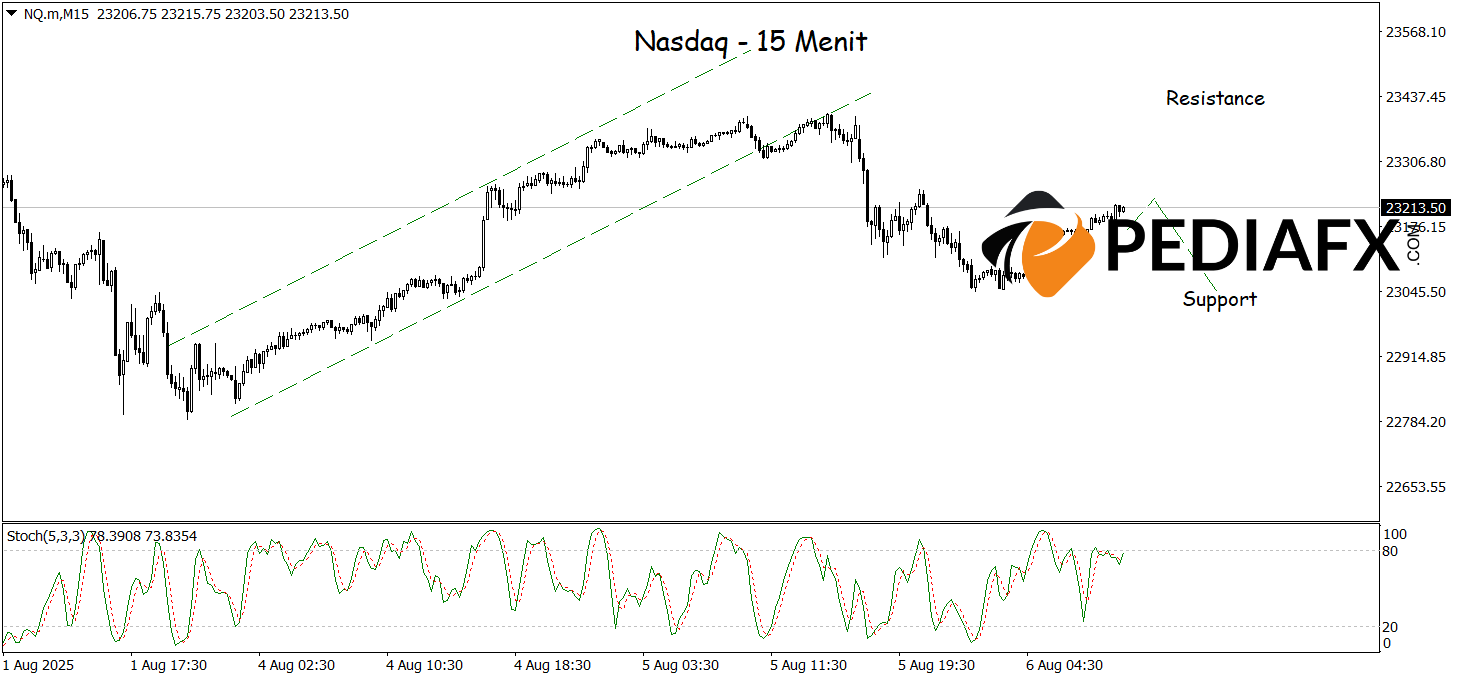
The Nasdaq has broken below (breaklow) the bullish channel on the 15-minute timeframe, signaling a technical shift that indicates the prior uptrend is losing momentum. This situation is reinforced by the Stochastic indicator being in the overbought region, suggesting an increasing likelihood of a downward reversal. With both signals combined, there is a viable chance for the Nasdaq to extend its decline toward the nearest support level at 23,040.
Technical Reference: sell if below 23,410
Potential Stop Loss 1: 23,340
Potential Stop Loss 2: 23,410
Potential Take Profit 1: 23,104
Potential Take Profit 2: 23,040


