

The bearish trend in the Nasdaq is still evidently strong, with the dominance of sellers becoming increasingly visible on the 1-hour timeframe. The price structure continues to form a consistent bearish channel, reflecting stable selling pressure from session to session. The downward trending Moving Average and the persistent ZigZag pattern, which indicates a series of lower highs and lower lows, further emphasize that buyers have not managed to counter the market pressure. This situation illustrates that the primary trend remains under the control of sellers, with potential upward corrections still limited.
Additional signals are provided by the MACD indicator, which continues to reside in the negative zone, signaling that bearish momentum shows no signs of weakening. The declining histogram reinforces the likelihood of the Nasdaq continuing its descent towards the nearest support level. As long as prices remain below the resistance area of the channel, and the indicators do not demonstrate a significant reversal, the bearish scenario is expected to remain the dominant trend in the near future.
Recommended

Recommended

Recommended

Recommended
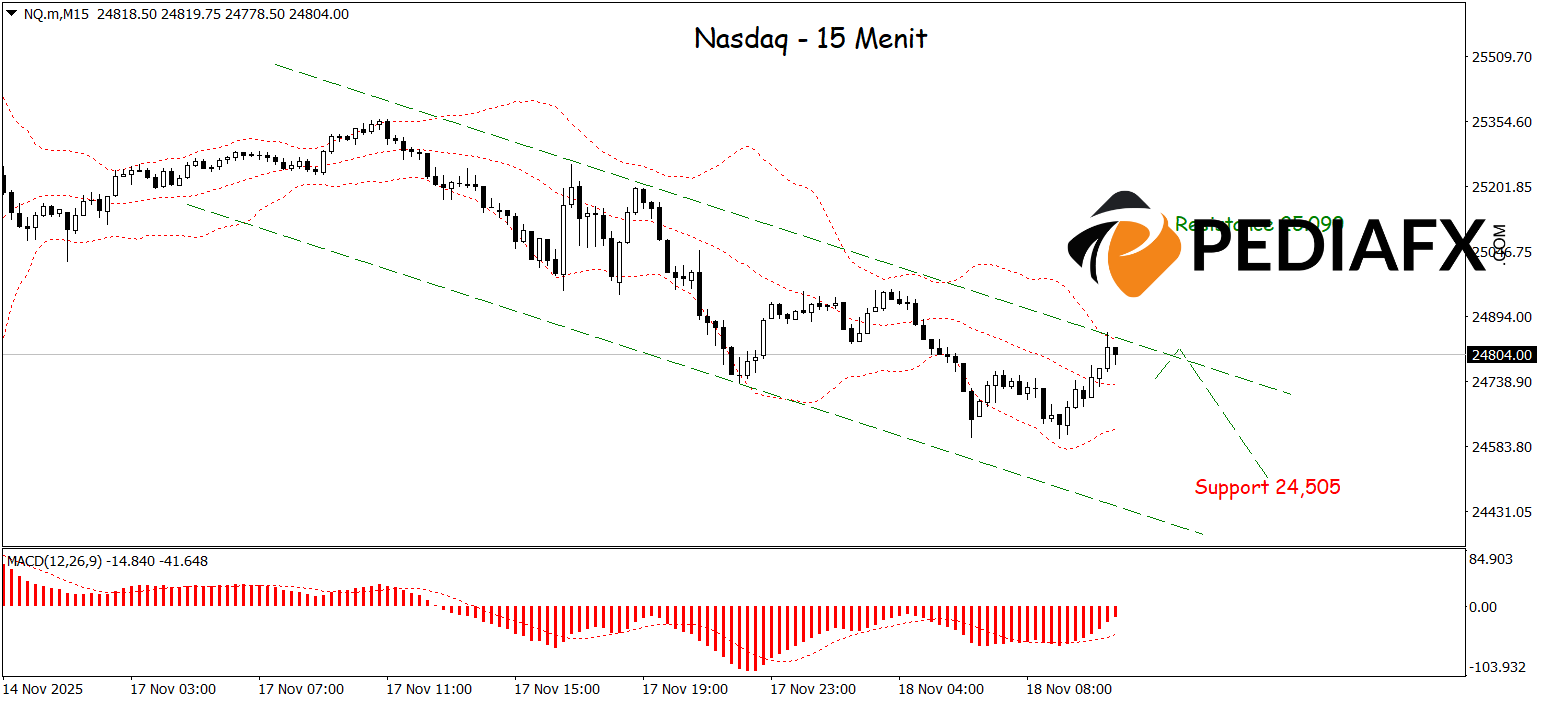
On the 15-minute chart, the established bearish channel further reinforces the dominance of selling pressure on the Nasdaq. The downward trajectory of the Bollinger Bands suggests an increase in volatility towards the downside, while the MACD indicator’s position in the negative zone strengthens the signal that bearish momentum is still prevailing. With this technical combination, the Nasdaq has the potential to continue its decline, testing an important support level at 24,505.
Technical Reference: sell below 25,090
Potential Stop Loss 1: 25,000
Potential Stop Loss 2: 25,090
Potential Take Profit 1: 24,610
Potential Take Profit 2: 24,505


