

The Nasdaq continues to demonstrate a robust bullish trend on the one-hour chart. The consistent zigzag pattern is forming an uptrend structure, indicating that buyers are still in control, maintaining the upward momentum. This signal is further reinforced by the position of the Moving Average (MA) situated below the price, providing strong support for the ongoing upward trend.
Moreover, the solid MACD indicator remains in positive territory, reinforcing the belief that the dominance of buyers persists. This combination of technical signals opens the door for the Nasdaq to continue its rally in the short term. As long as this uptrend pattern holds, the potential for testing higher resistance levels is wide open, with a market outlook leaning towards bullish.
Recommended

Recommended

Recommended

Recommended
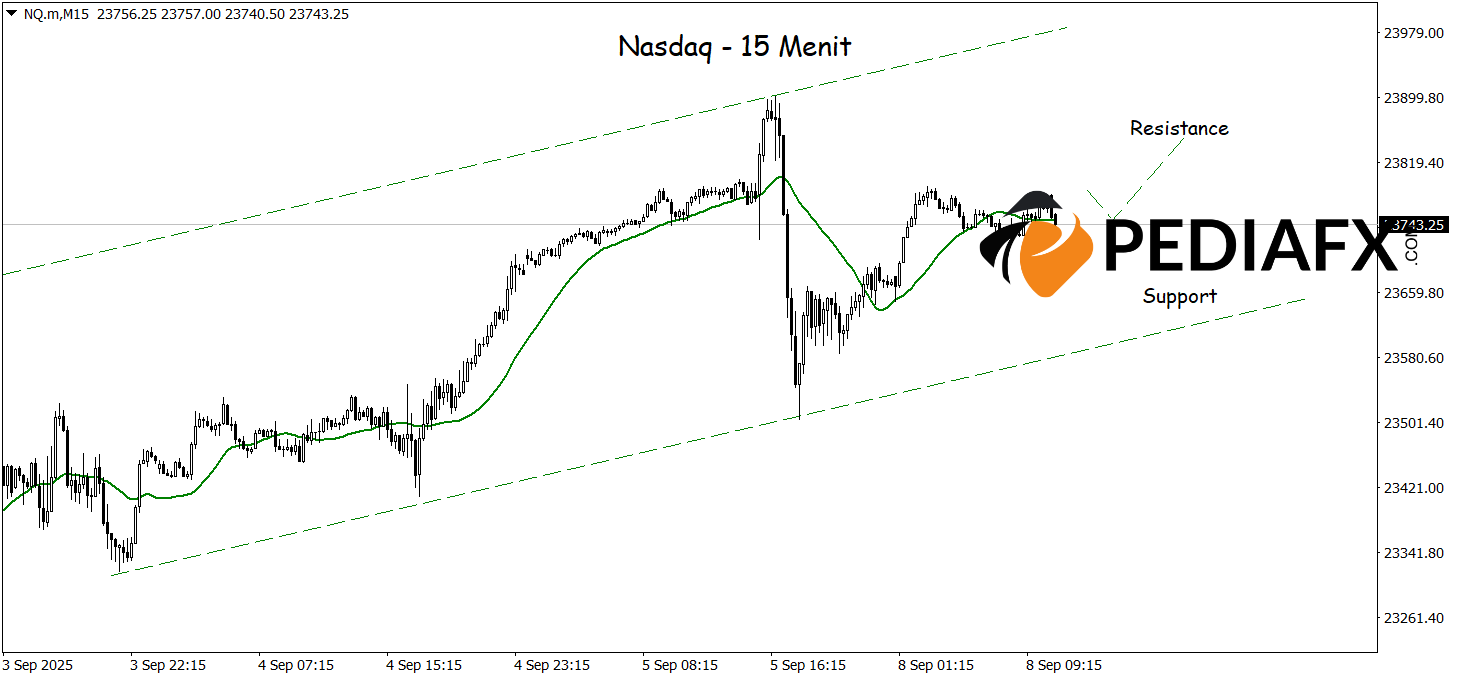
On the 15-minute chart, the established bullish channel for the Nasdaq indicates an increasing potential for gains, bolstered by the Moving Average (MA) that, while relatively flat, continues to trend upwards. This technical condition strengthens the grip of buyers, creating opportunities for the Nasdaq to continue its short-term rally and potentially test the nearest resistance area at the 23,850 level.
Technical Reference: buy as long as it remains above 23,660
Potential Take Profit 1: 23,812
Potential Take Profit 2: 23,850
Potential Stop Loss 1: 23,710
Potential Stop Loss 2: 23,660


