

The Nasdaq index on the 1-hour chart is confidently moving within a bullish channel, indicating that the buyer dominance is still intact, even though the price has yet to break through the key resistance. The upward trend structure remains clearly visible, with prices consistently following the channel path, although there are signs of caution from the market regarding the continuation of this rally.
From a technical perspective, the formation of Higher Highs (HH) and Higher Lows (HL) as indicated by the ZigZag tool reinforces the ongoing bullish trend. The consistently rising Moving Average (MA) further bolsters the positive outlook, although short-term momentum appears to be slightly slowing down.
Recommended

Recommended

Recommended

Recommended
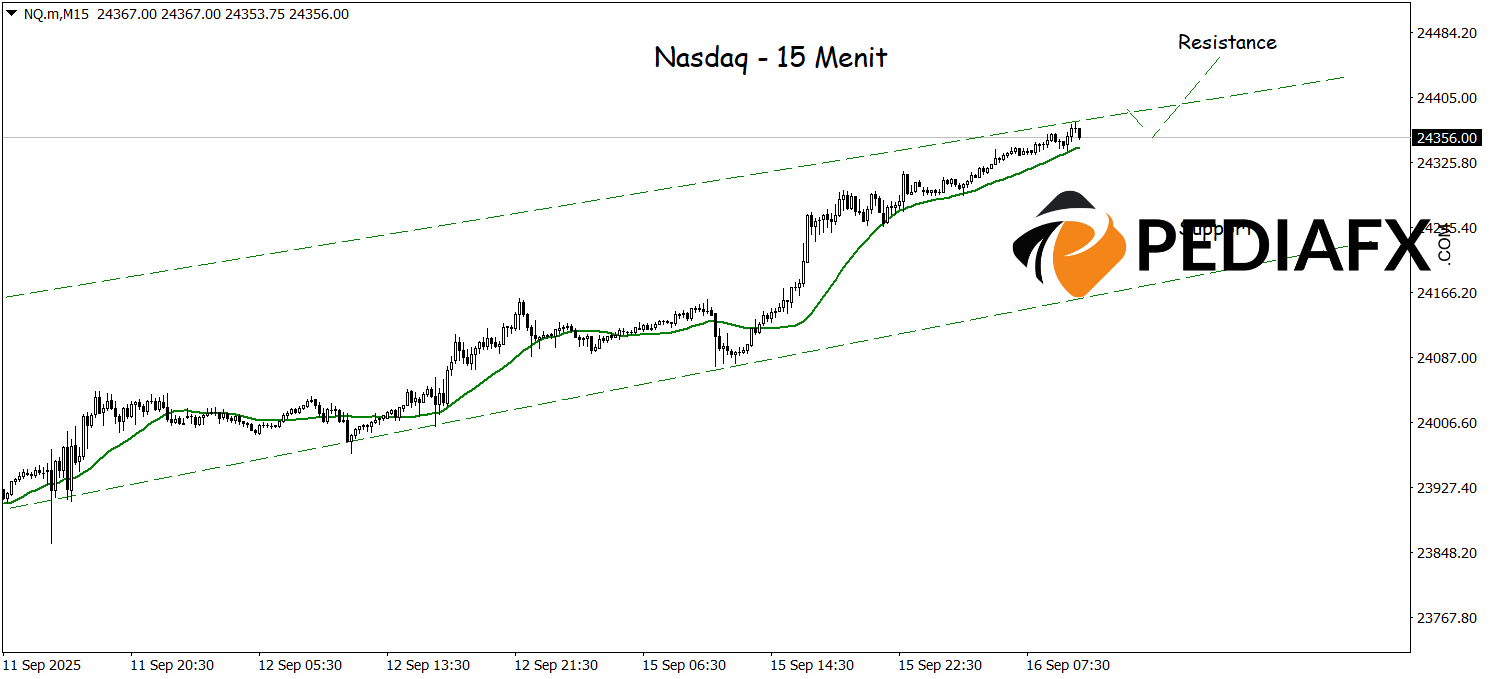
On the 15-minute chart, the Nasdaq continues to hold its position within the bullish channel with MA once again trending upwards, signaling a potential for further strengthening. With this combination, the index might test the crucial resistance at 24,458, and it could pave the way for a new rally if that level is convincingly breached.
Technical Reference: buy as long as above 24,255
Potential Take Profit 1: 24,422
Potential Take Profit 2: 24,458
Potential Stop Loss 1: 24,295
Potential Stop Loss 2: 24,255


