


The Nasdaq’s movements in the 1-hour time frame reveal a persistent uptrend within an established bullish channel that has been active since late May 2025. The price structure continues to consistently form Higher Highs (HH) and Higher Lows (HL), signaling ongoing buying pressure. Currently, the price is creating a new HL near the midpoint of the channel, reinforcing the validity of the ongoing uptrend pattern.
The CCI indicator also indicates conditions nearing the oversold territory, suggesting the possibility of a rebound in the near term. As long as the price remains within the bullish channel and the HL structure is not broken, the potential for the Nasdaq to rise towards the top resistance level of the channel remains intact.

Recommended

Recommended

Recommended

Recommended
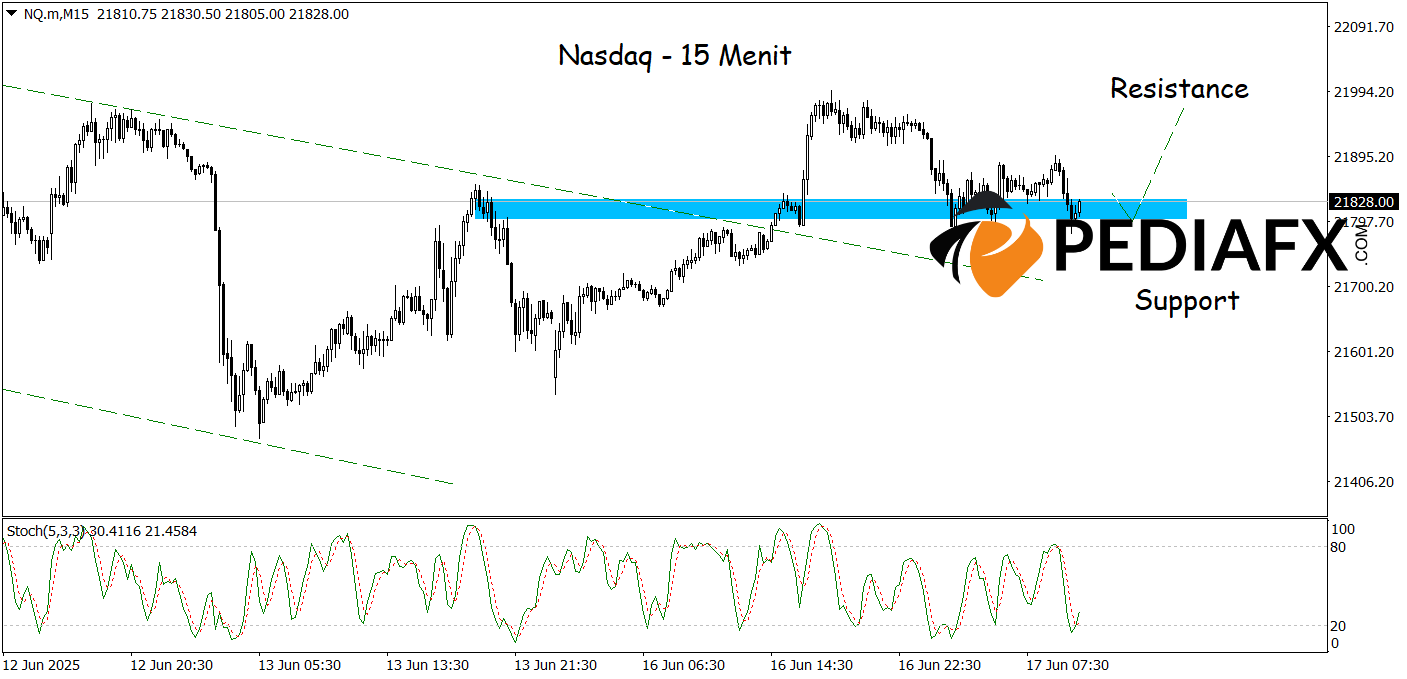
In the 15-minute time frame, the Nasdaq shows potential for a rebound after retesting a support zone that also represents a prior breakout area. This level has proven to be a critical boundary, containing selling pressure in recent hours. Signals from the Stochastic indicator approaching the oversold area further support the likelihood of price bouncing off this zone. If it manages to hold and bounce from the blue support level, Nasdaq could potentially retest the nearest resistance around 21,970.
Technical References: buy if above 21,687
Potential Take Profit 1: 21,925
Potential Take Profit 2: 21,970
Potential Stop Loss 1: 21,735
Potential Stop Loss 2: 21,687








