

On the hourly chart, the Nasdaq continues to exhibit a strong bullish trend, clearly showcasing the dominance of buyers. A consistent zigzag pattern forming higher highs (HH) and higher lows (HL) provides strong confirmation that the upward direction is still intact. This signal is further supported by a rising Moving Average (MA), indicating that the possibility for continued gains remains wide open.
The strength of the trend is also reflected in the price’s ability to hold above a dynamic support zone, which suggests that buying pressure continues to dominate the market. As long as the price remains above this crucial level, the Nasdaq’s potential for an upward movement is maintained, with the possibility of testing the nearest resistance during the midday European session.
Recommended

Recommended

Recommended

Recommended
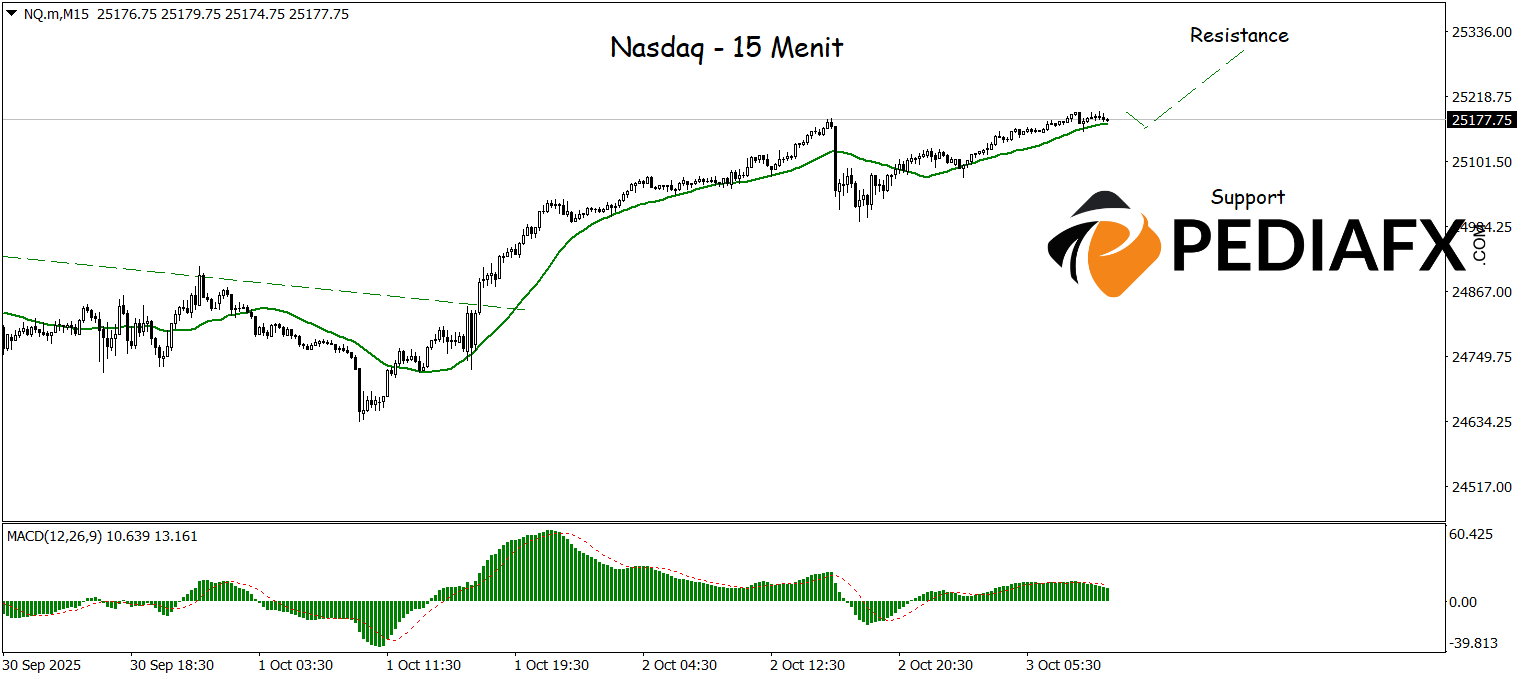
Meanwhile, on the 15-minute timeframe, the bullish signals are strengthening as the Nasdaq successfully breaks through the bearish trendline. The recent upward shift in the MA adds additional support, paving the way for a continuation of the rally with a key resistance target around 25,315.
Technical Reference: buy while above 25,055
Potential Take Profit 1: 25,250
Potential Take Profit 2: 25,315
Potential Stop Loss 1: 25,098
Potential Stop Loss 2: 25,055


