

The Nasdaq index has shown signs of weakening as it failed to break through the resistance zone within a bullish channel during tonight’s trading session. The rejection of prices from this area indicates that buying pressure is beginning to fade, while selling pressure is gradually increasing. The sharp decline in the CCI indicator from overbought territory reinforces the signal that the momentum of the uptrend is starting to lose steam. This condition serves as an early indication that the market could be poised for a correction following a prolonged uptrend observed in recent sessions.
From a technical perspective, the directional shift of the Moving Average (MA) beginning to decline further emphasizes the potential shift in momentum from bullish to bearish in the short term. If selling pressure continues, the Nasdaq may experience a deeper correction to test the nearest support level. As long as prices do not manage to break back through the resistance zone, the potential for a correction remains, and buyers are likely to wait for confirmation of a reversal signal before re-entering the market.
Recommended

Recommended

Recommended

Recommended
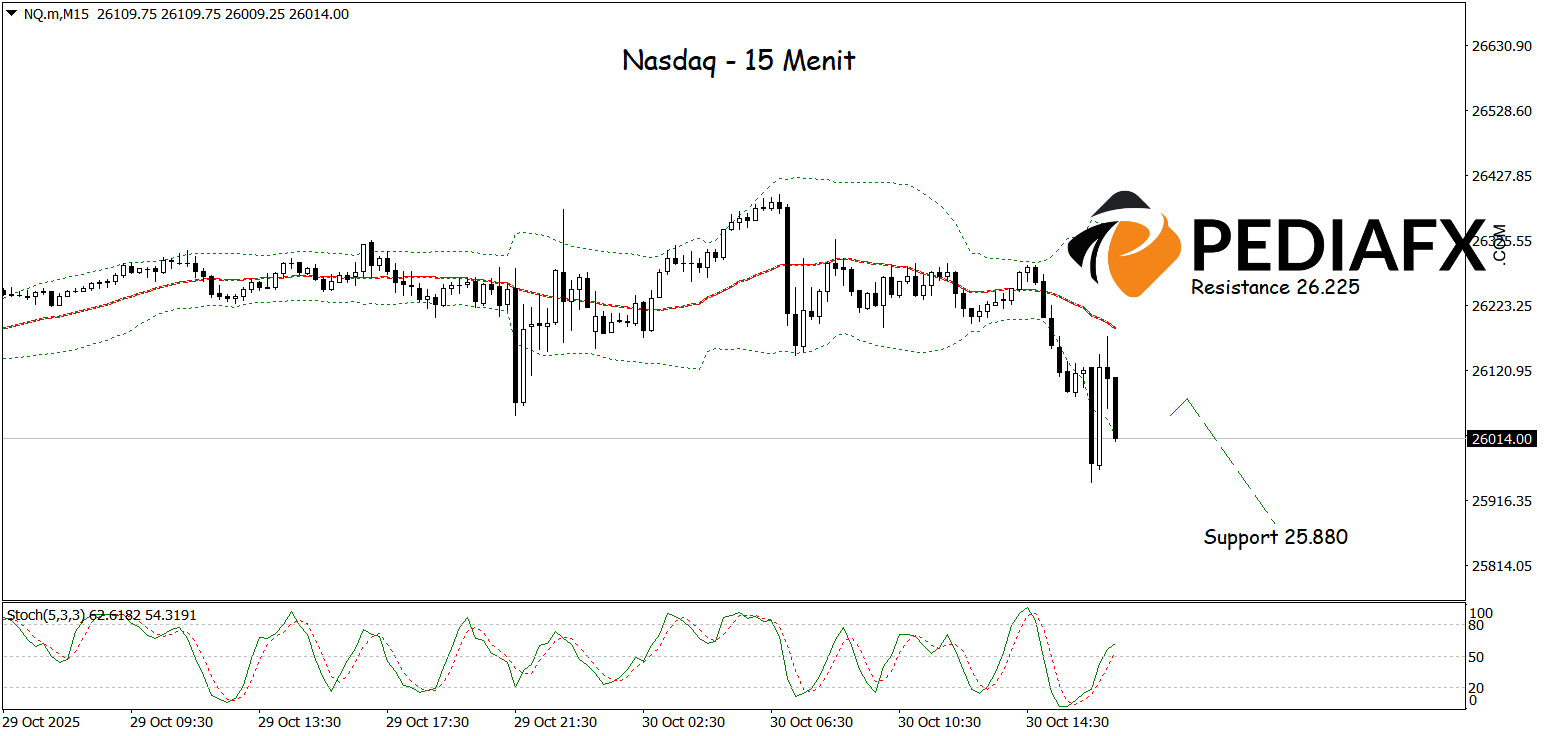
The Nasdaq may face downward pressure as prices breach the lower area of the Bollinger Bands (BB) on the 15-minute time frame. The declining direction of the Moving Average (MA) indicates that seller dominance remains strong, while the Stochastic indicator moving from the overbought area strengthens the correction signal. This combination of technical signals suggests that the Nasdaq may continue its decline to test the nearest support level at 25,880.
Technical Reference: sell while below 26,225
Potential Take Profit 1: 26,153
Potential Take Profit 2: 26,225
Potential Stop Loss 1: 25,960
Potential Stop Loss 2: 25,880


