

The Nasdaq has signaled strengthening after confirming a double bottom reversal pattern on the 1-hour timeframe. The breakout at the neckline serves as a crucial indicator that selling pressure is beginning to decrease, creating more opportunities for buyers. This technical confirmation illustrates a shift in market sentiment, as the price structure starts to support further upward potential.
The ZigZag and Moving Average (MA) indicators remain in a bullish position, further bolstering the chances of a rally, along with the MACD maintaining a positive outlook as an extra boost for buyers. The combination of the double bottom pattern, neckline breakout, and supportive technical indicators places the Nasdaq on a prepared bullish trajectory. As long as the price remains above the breakout area, the potential for continued increases stays open, targeting the nearest resistance on the 1-hour timeframe.
Recommended

Recommended

Recommended

Recommended
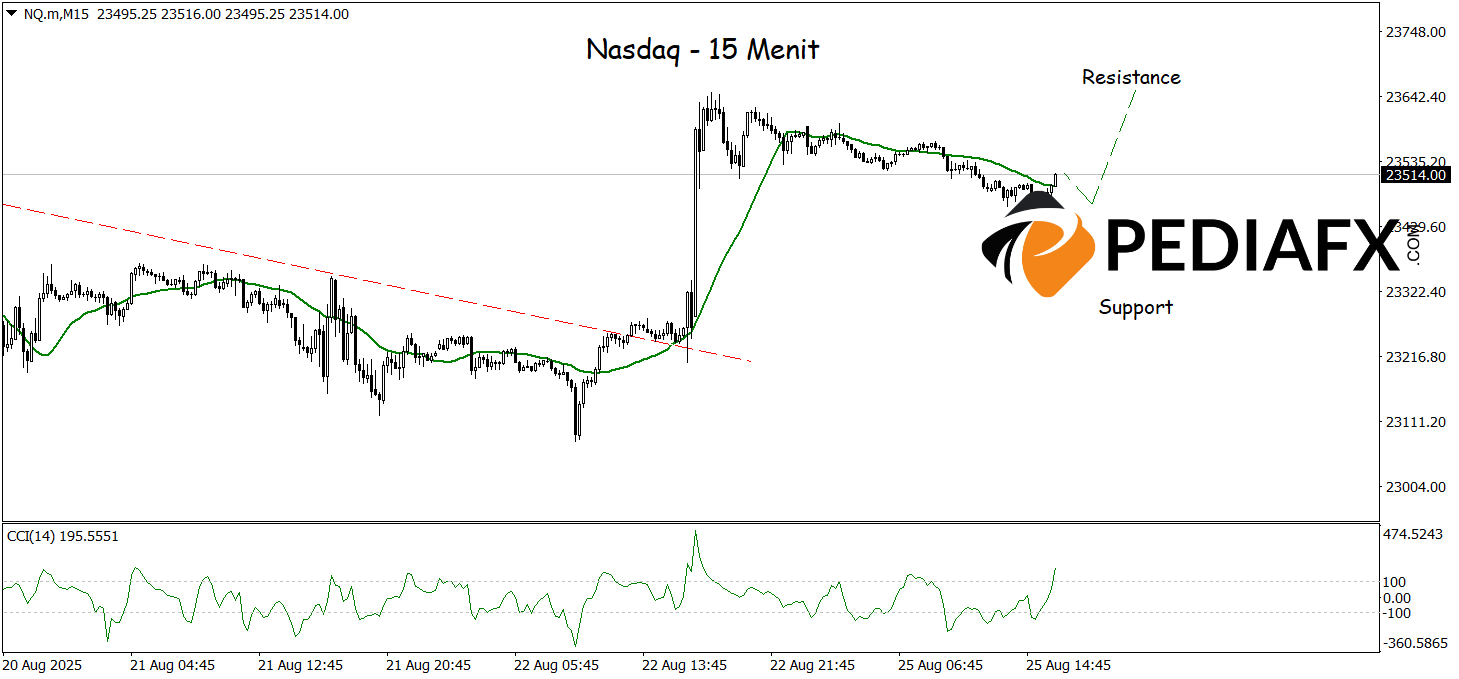
The Nasdaq reveals potential strengthening on the 15-minute timeframe after successfully breaking the high of the bearish trendline, supported by the Moving Average (MA) trend starting to flatten with an upward bias. Additional signals emerge from the CCI indicator that has rebounded from the oversold zone, thereby reinforcing the likelihood of Nasdaq testing the nearest resistance at 23,650.
Technical Reference: buy while above 23,313
Potential Take Profit 1: 23,588
Potential Take Profit 2: 23,650
Potential Stop Loss 1: 23,377
Potential Stop Loss 2: 23,313


