


The Nasdaq continues to demonstrate a strong upward trend, with price movements consistently remaining within a bullish channel on the 1-hour timeframe. The stable price structure and persistent upward patterns indicate that buyers remain dominant in the market. The Zigzag indicator also confirms a Higher High and Higher Low pattern, reinforcing the technical signals that the bullish trend is well-supported. As long as prices do not breach the lower boundary of the channel, the potential for continued upward movement remains open.
Additional support comes from the Moving Average (MA) indicator, which consistently trends upward, demonstrating that bullish momentum is still active. This MA not only serves as a trend confirmation but also acts as dynamic support that mitigates short-term selling pressure. With the alignment of signals from the bullish channel, Zigzag, and MA helping to reinforce the upward trajectory, the Nasdaq is viewed as having a considerable chance to continue rising towards the next resistance area, especially if market sentiment remains favorable.

Recommended

Recommended

Recommended

Recommended
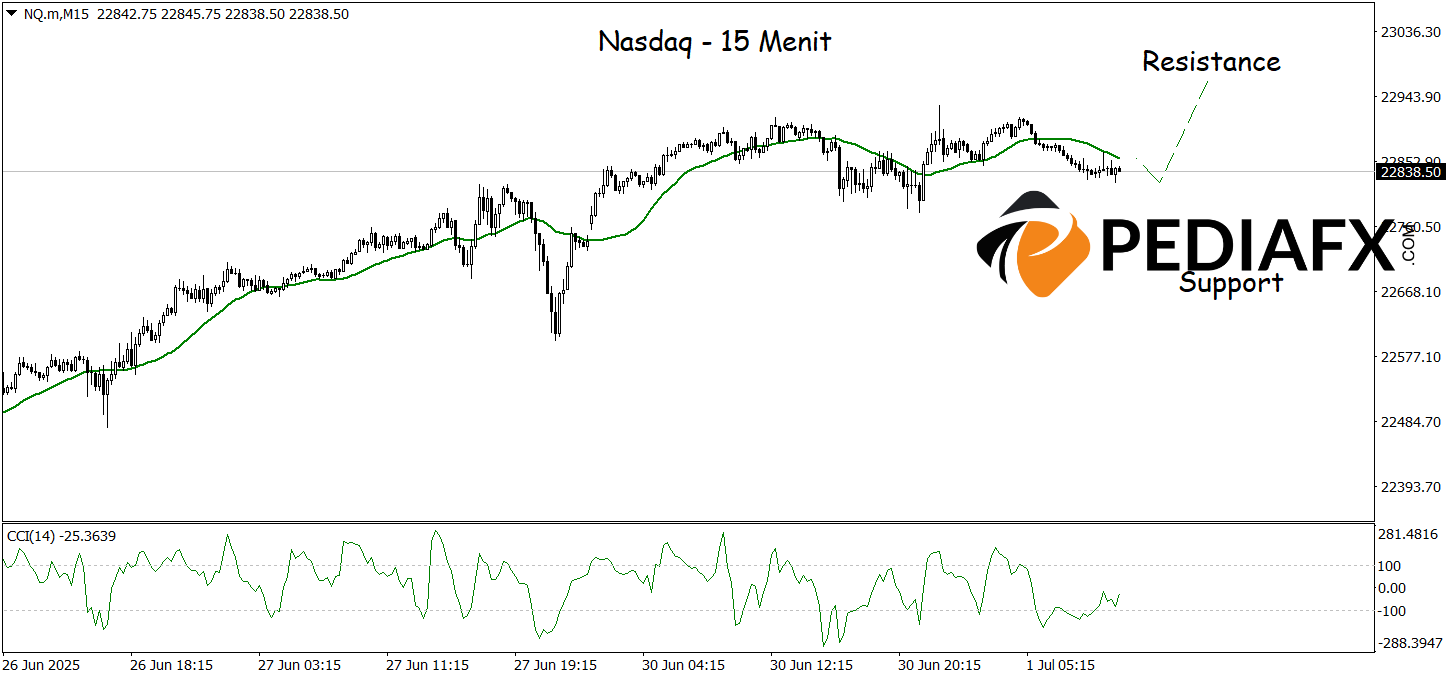
On the 15-minute timeframe, the Nasdaq still shows potential for upward movement, with technical signals supporting the ongoing bullish trend. The upward-sloping Moving Average (MA) reflects the strength of the prevailing bullish trend, while the MACD indicator is also in the positive zone, indicating that buying momentum remains strong. As long as prices stay above the MA and do not penetrate minor support levels, the potential for an ongoing uptrend remains wide open, with targets towards the nearest resistance area at 22,960.
Technical Reference: buy while above 22,700
Potential Take Profit 1: 22,900
Potential Take Profit 2: 22,960
Potential Stop Loss 1: 22,745
Potential Stop Loss 2: 22,700








